Introduction
Risk scenarios describe in detail the asset at risk, who or what can act against it, their intent or motivation (if applicable), the circumstances and threat actor methods associated with the threat event, the effect on the company if/when it happens, and when or how often the event might occur. All Risk Scenarios in SAFE are fully FAIR-compliant and built upon the FAIR methodology.
SAFE provides an Out-of-the-Box (OOTB) Risk Scenario Library, offering a comprehensive set of pre-defined Risk Scenarios to expedite the risk assessment process.
Each Risk Scenario generates key risk assessment outputs, including:
Likelihood
Loss Magnitude
Annualized Loss
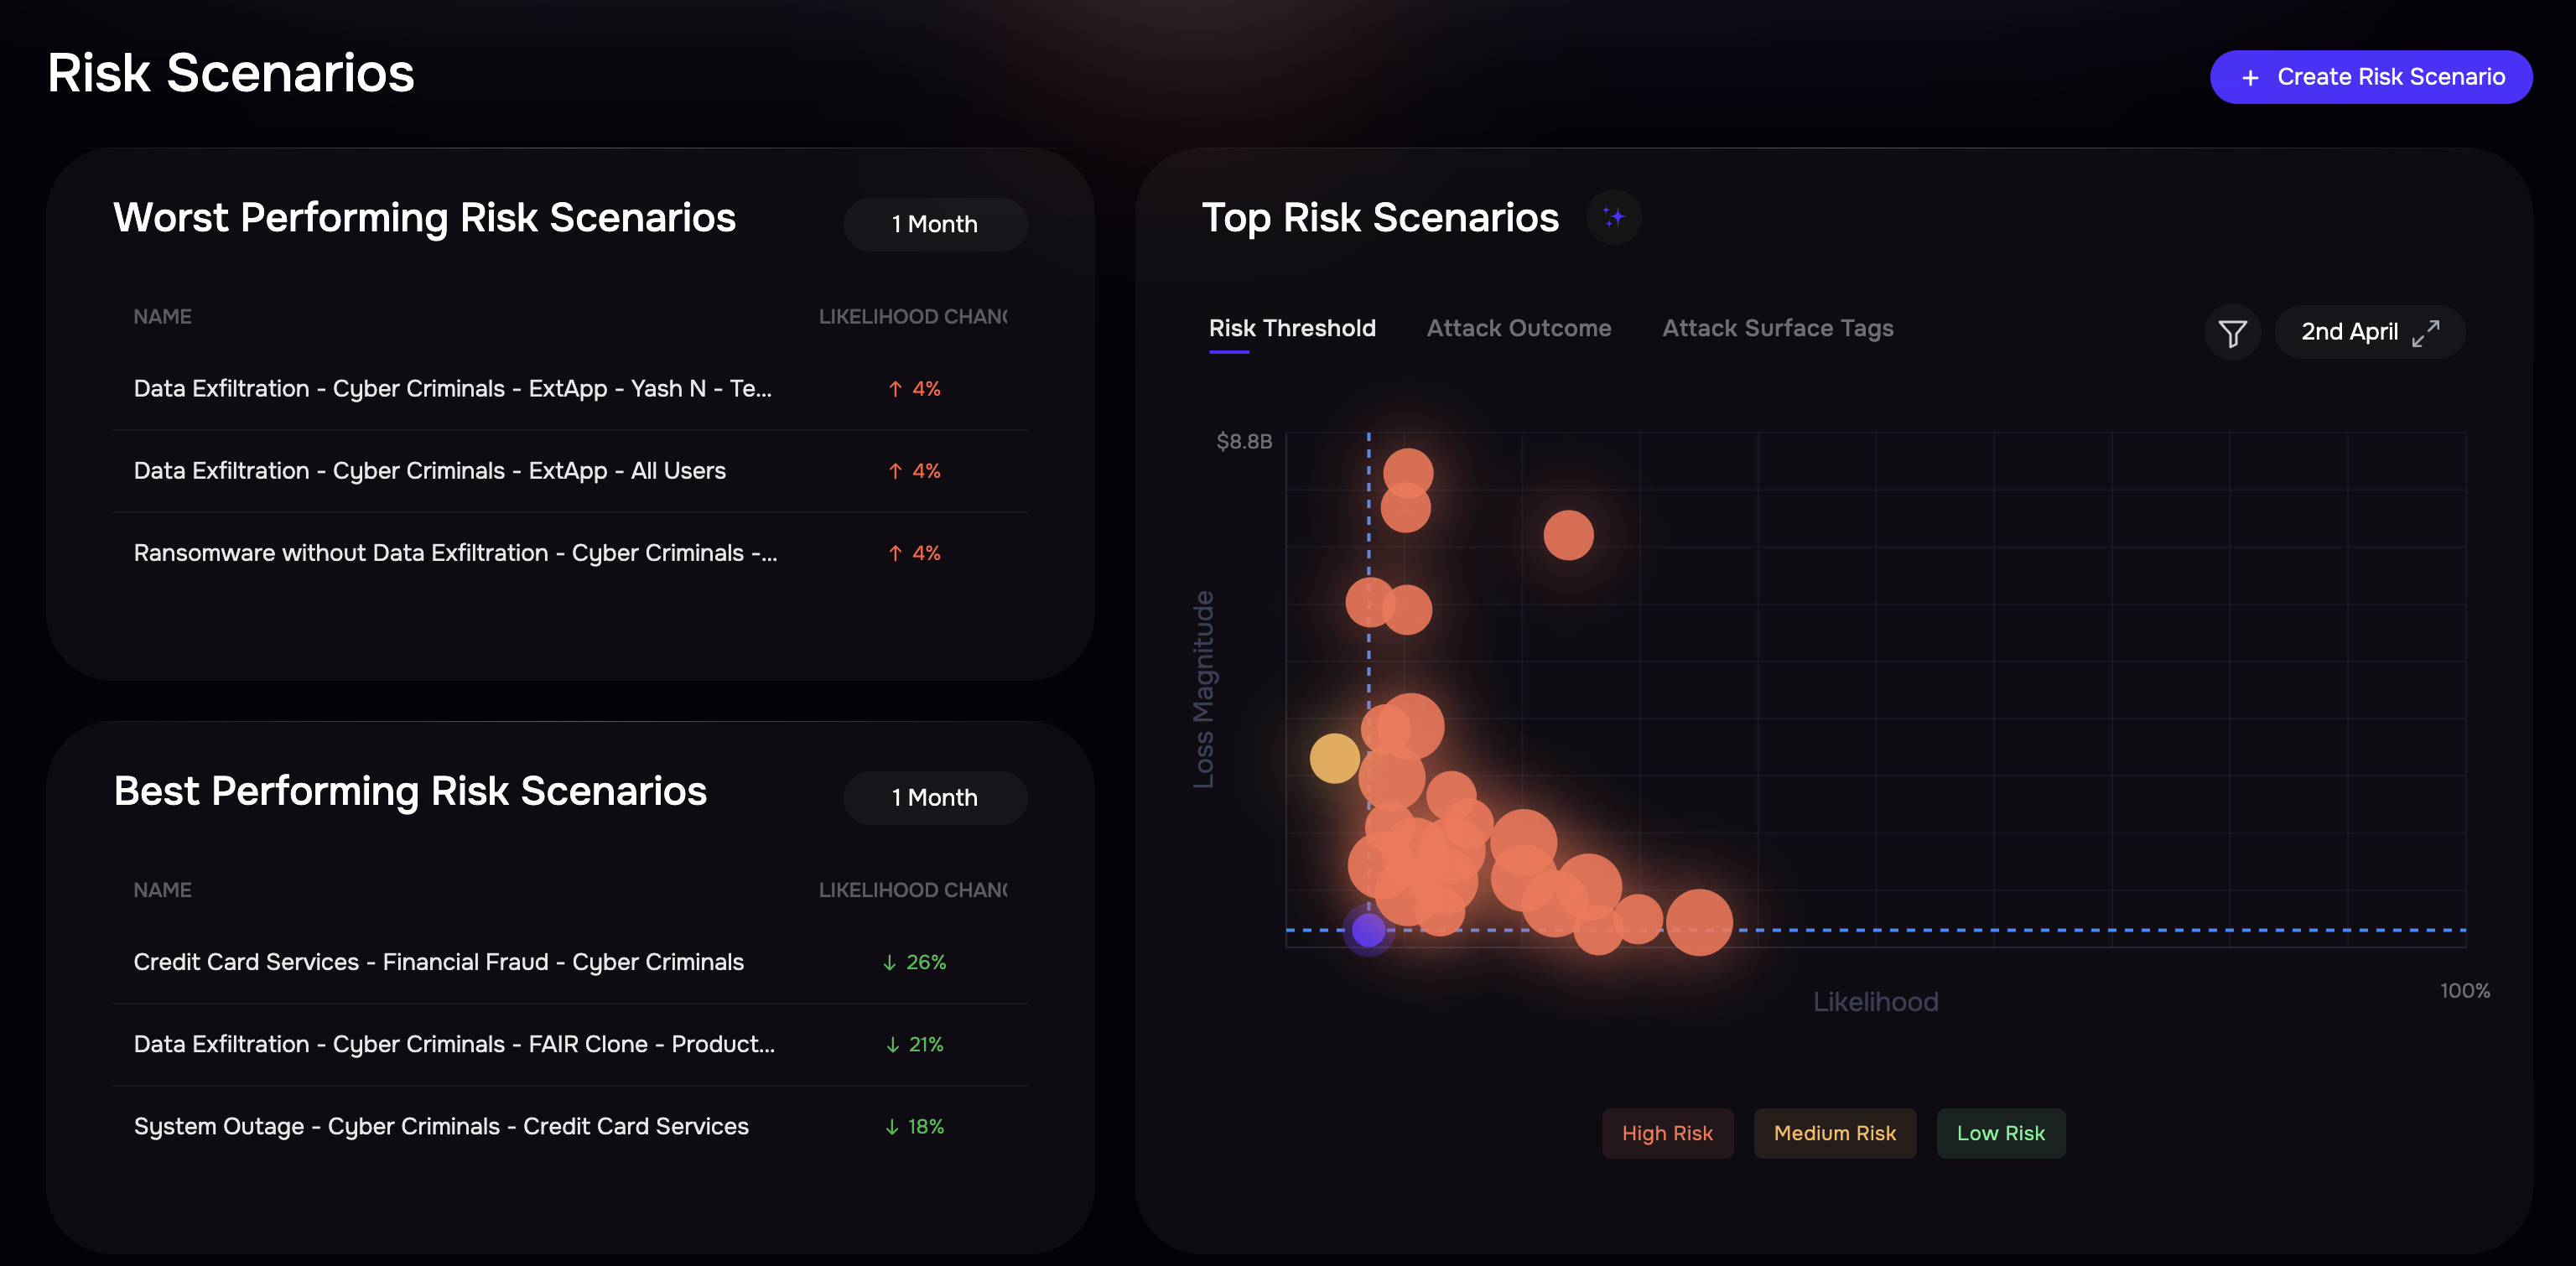
The Risk Scenario page in SAFE provides an overview of risk scenarios and key insights. It includes:
Top Risk Scenario Bubble Graph: A visual representation of Likelihood vs. Loss Magnitude.
Worst Performing Risk Scenarios: Displays high-risk scenarios requiring attention.
Best Performing Risk Scenarios: Shows scenarios with lower risk impact.
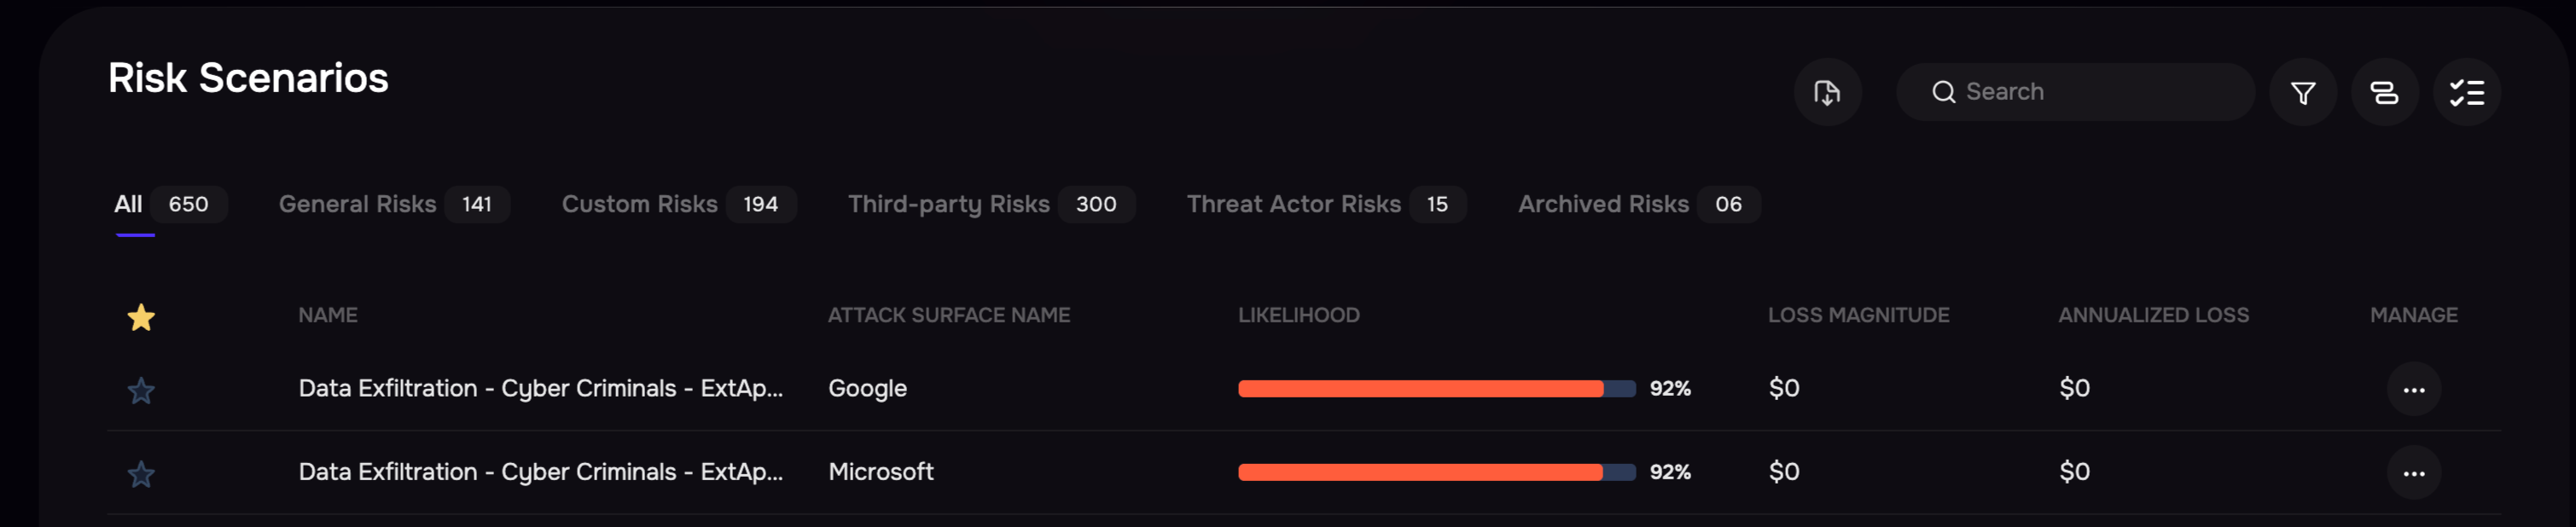
Risk Scenarios Table: Displays all available risk scenarios with filtering and grouping options.
Managing the group list table
You can group the risk scenario table, apply filters, manage columns, search, and export the group list.
Grouping: You can group risk scenarios based on:
Risk Scenario Category
Attack Outcome
Threat Actor
Initial Attack Methods
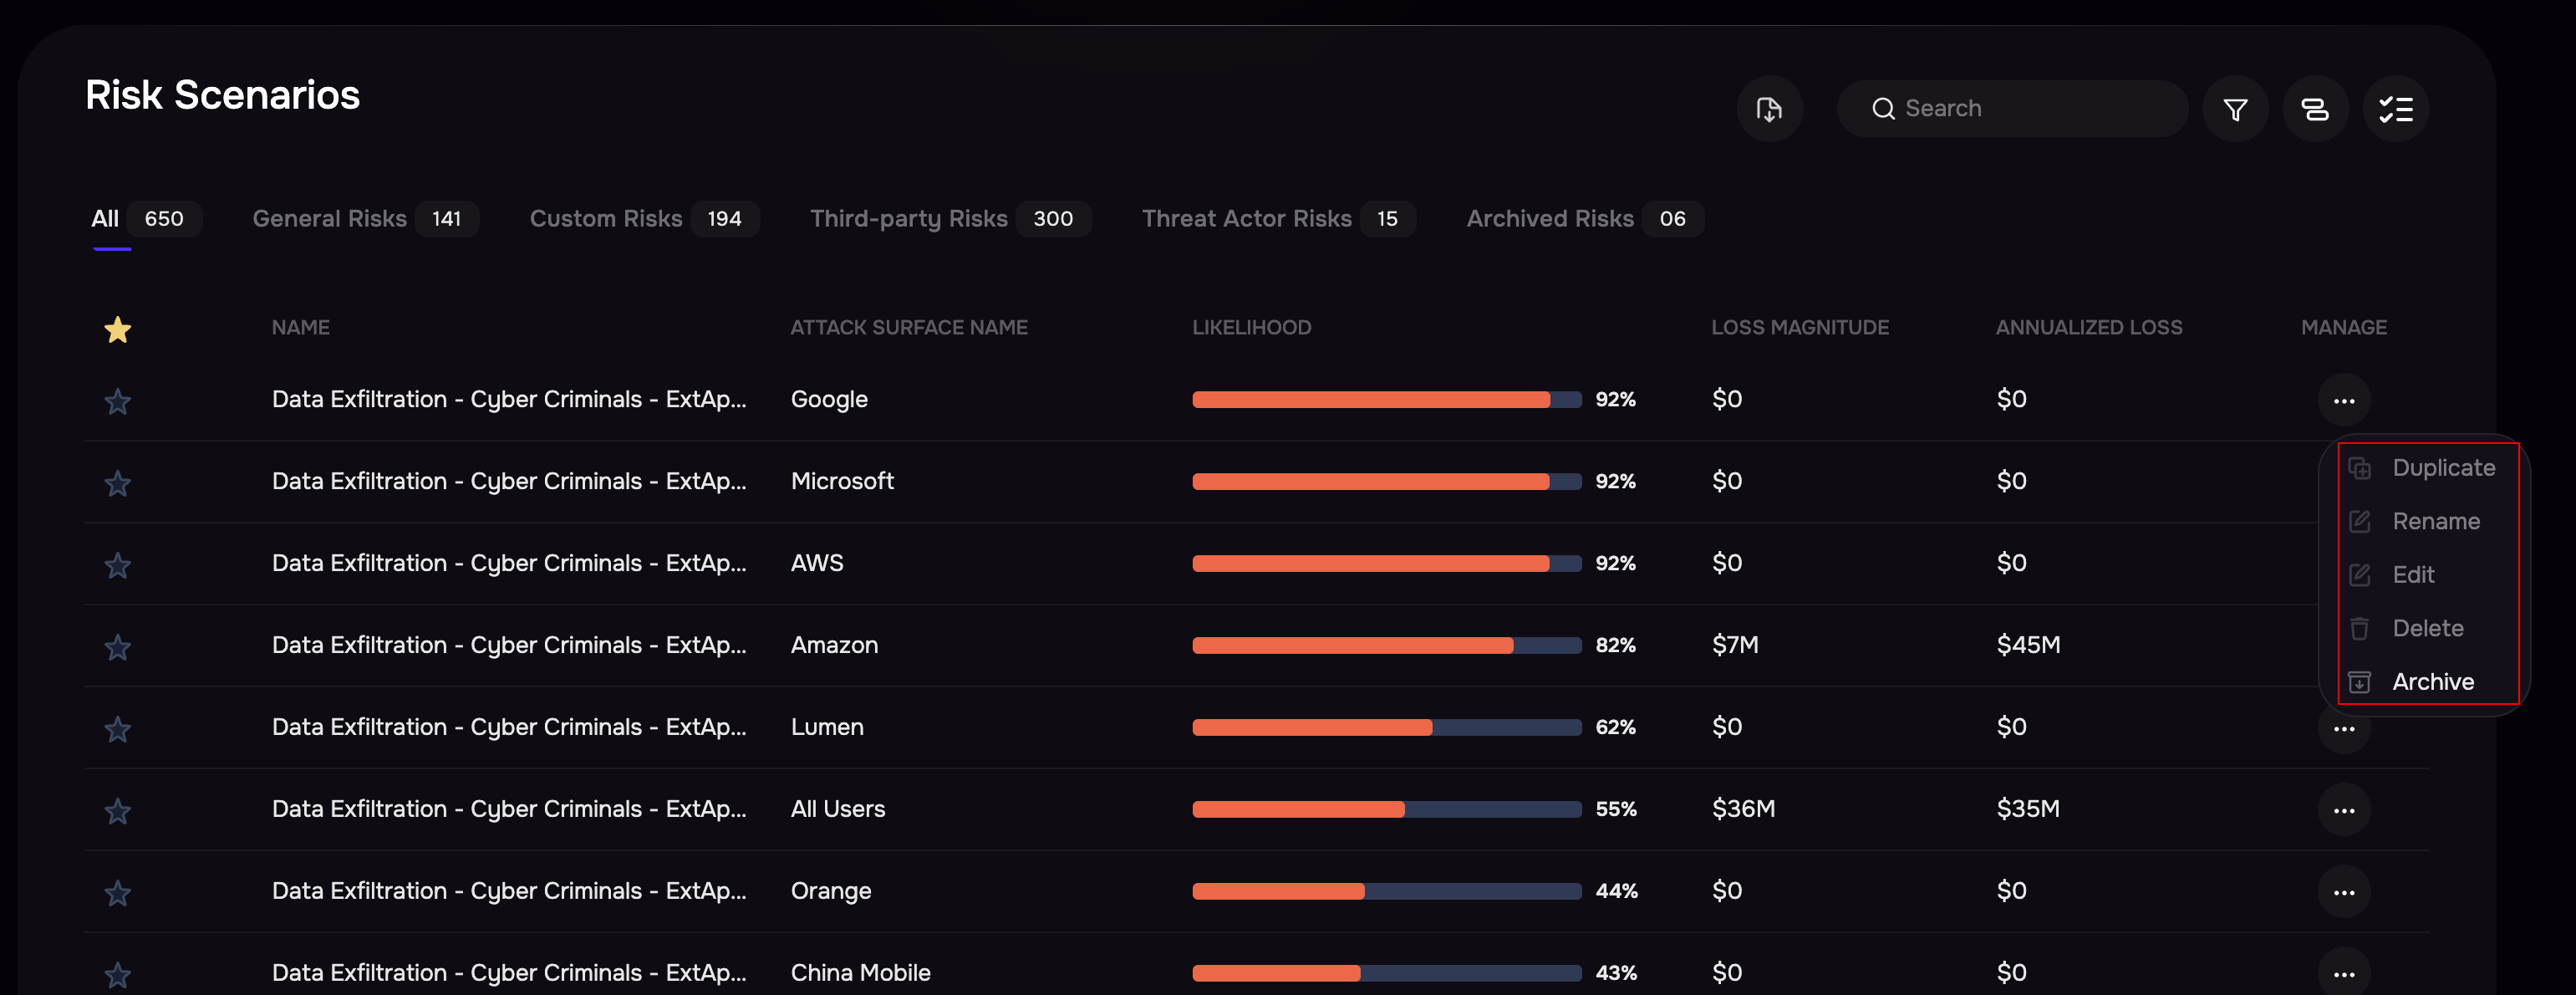
More Actions
Each Risk Scenario has a three-dot options menu providing the following actions:
Edit: Redirects you to the five-step wizard for updating scenario details.
Duplicate: This creates a duplicate of the risk scenario with existing details.
Note on Loss Driver
When you duplicate a risk scenario from one group (source) to another (target), only the overridden loss drivers from the source will be copied over. The remaining loss driver values will automatically adjust based on the target group's assessments and revenue.
Delete: Removes the selected risk scenario.
Archive: Moves the scenario to archived records.
Rename: Allows renaming the risk scenario.
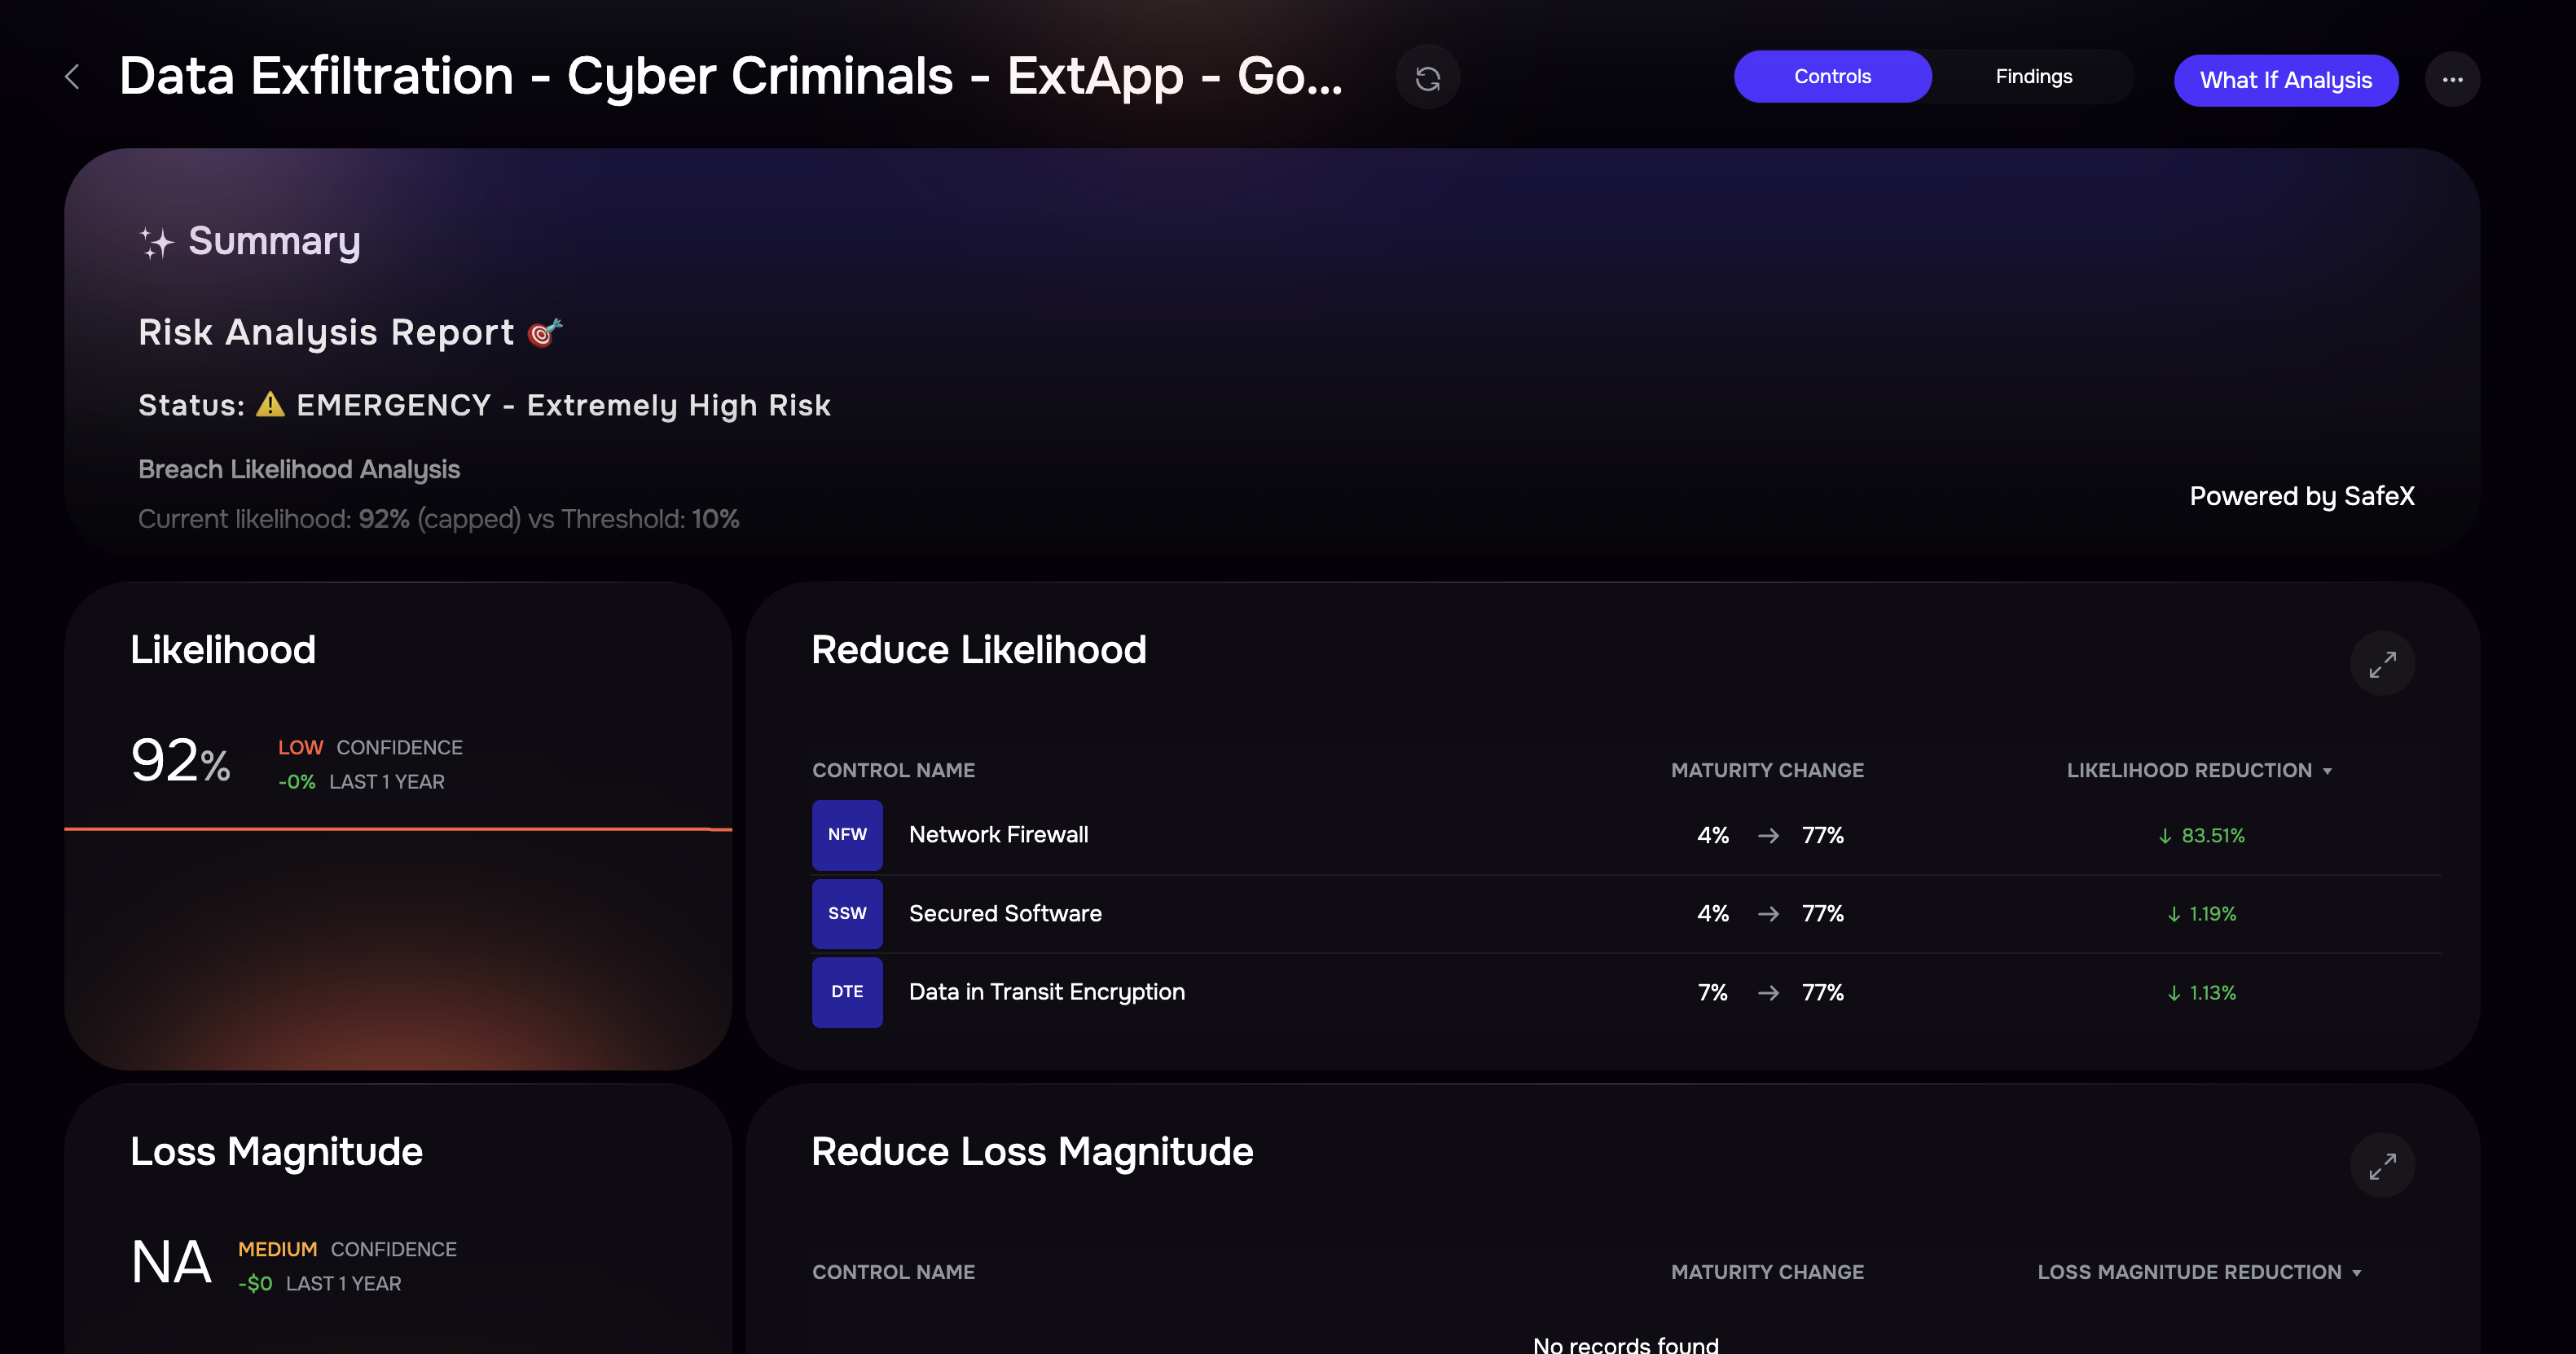
Risk Scenario Details
Clicking on a Risk Scenario opens its detail page, which includes:
AI Summary
Likelihood and Loss Magnitude
Risk Scenario Composition and related details
The detail page also allows you to perform various actions such as:
Switch to Controls and Findings View
What-If Analysis
See What Changed
MITRE ATT&CK View
Control View