See What Changed - Introduction
"See What Changed" helps you track and understand how risk has evolved over time within your organization. This feature allows you to review key changes in your environment, providing insights into variations in risk scenarios, attack surfaces, financial impacts, and more.
Access the "See What Changed" page for a Risk Scenario
There are two ways to access this feature:
Via Trend Widget: Clicking on any of the trend widgets (Likelihood, Loss Magnitude, or Annualized Loss) on the Risk Scenario page, you will be redirected to the See What Changed page.
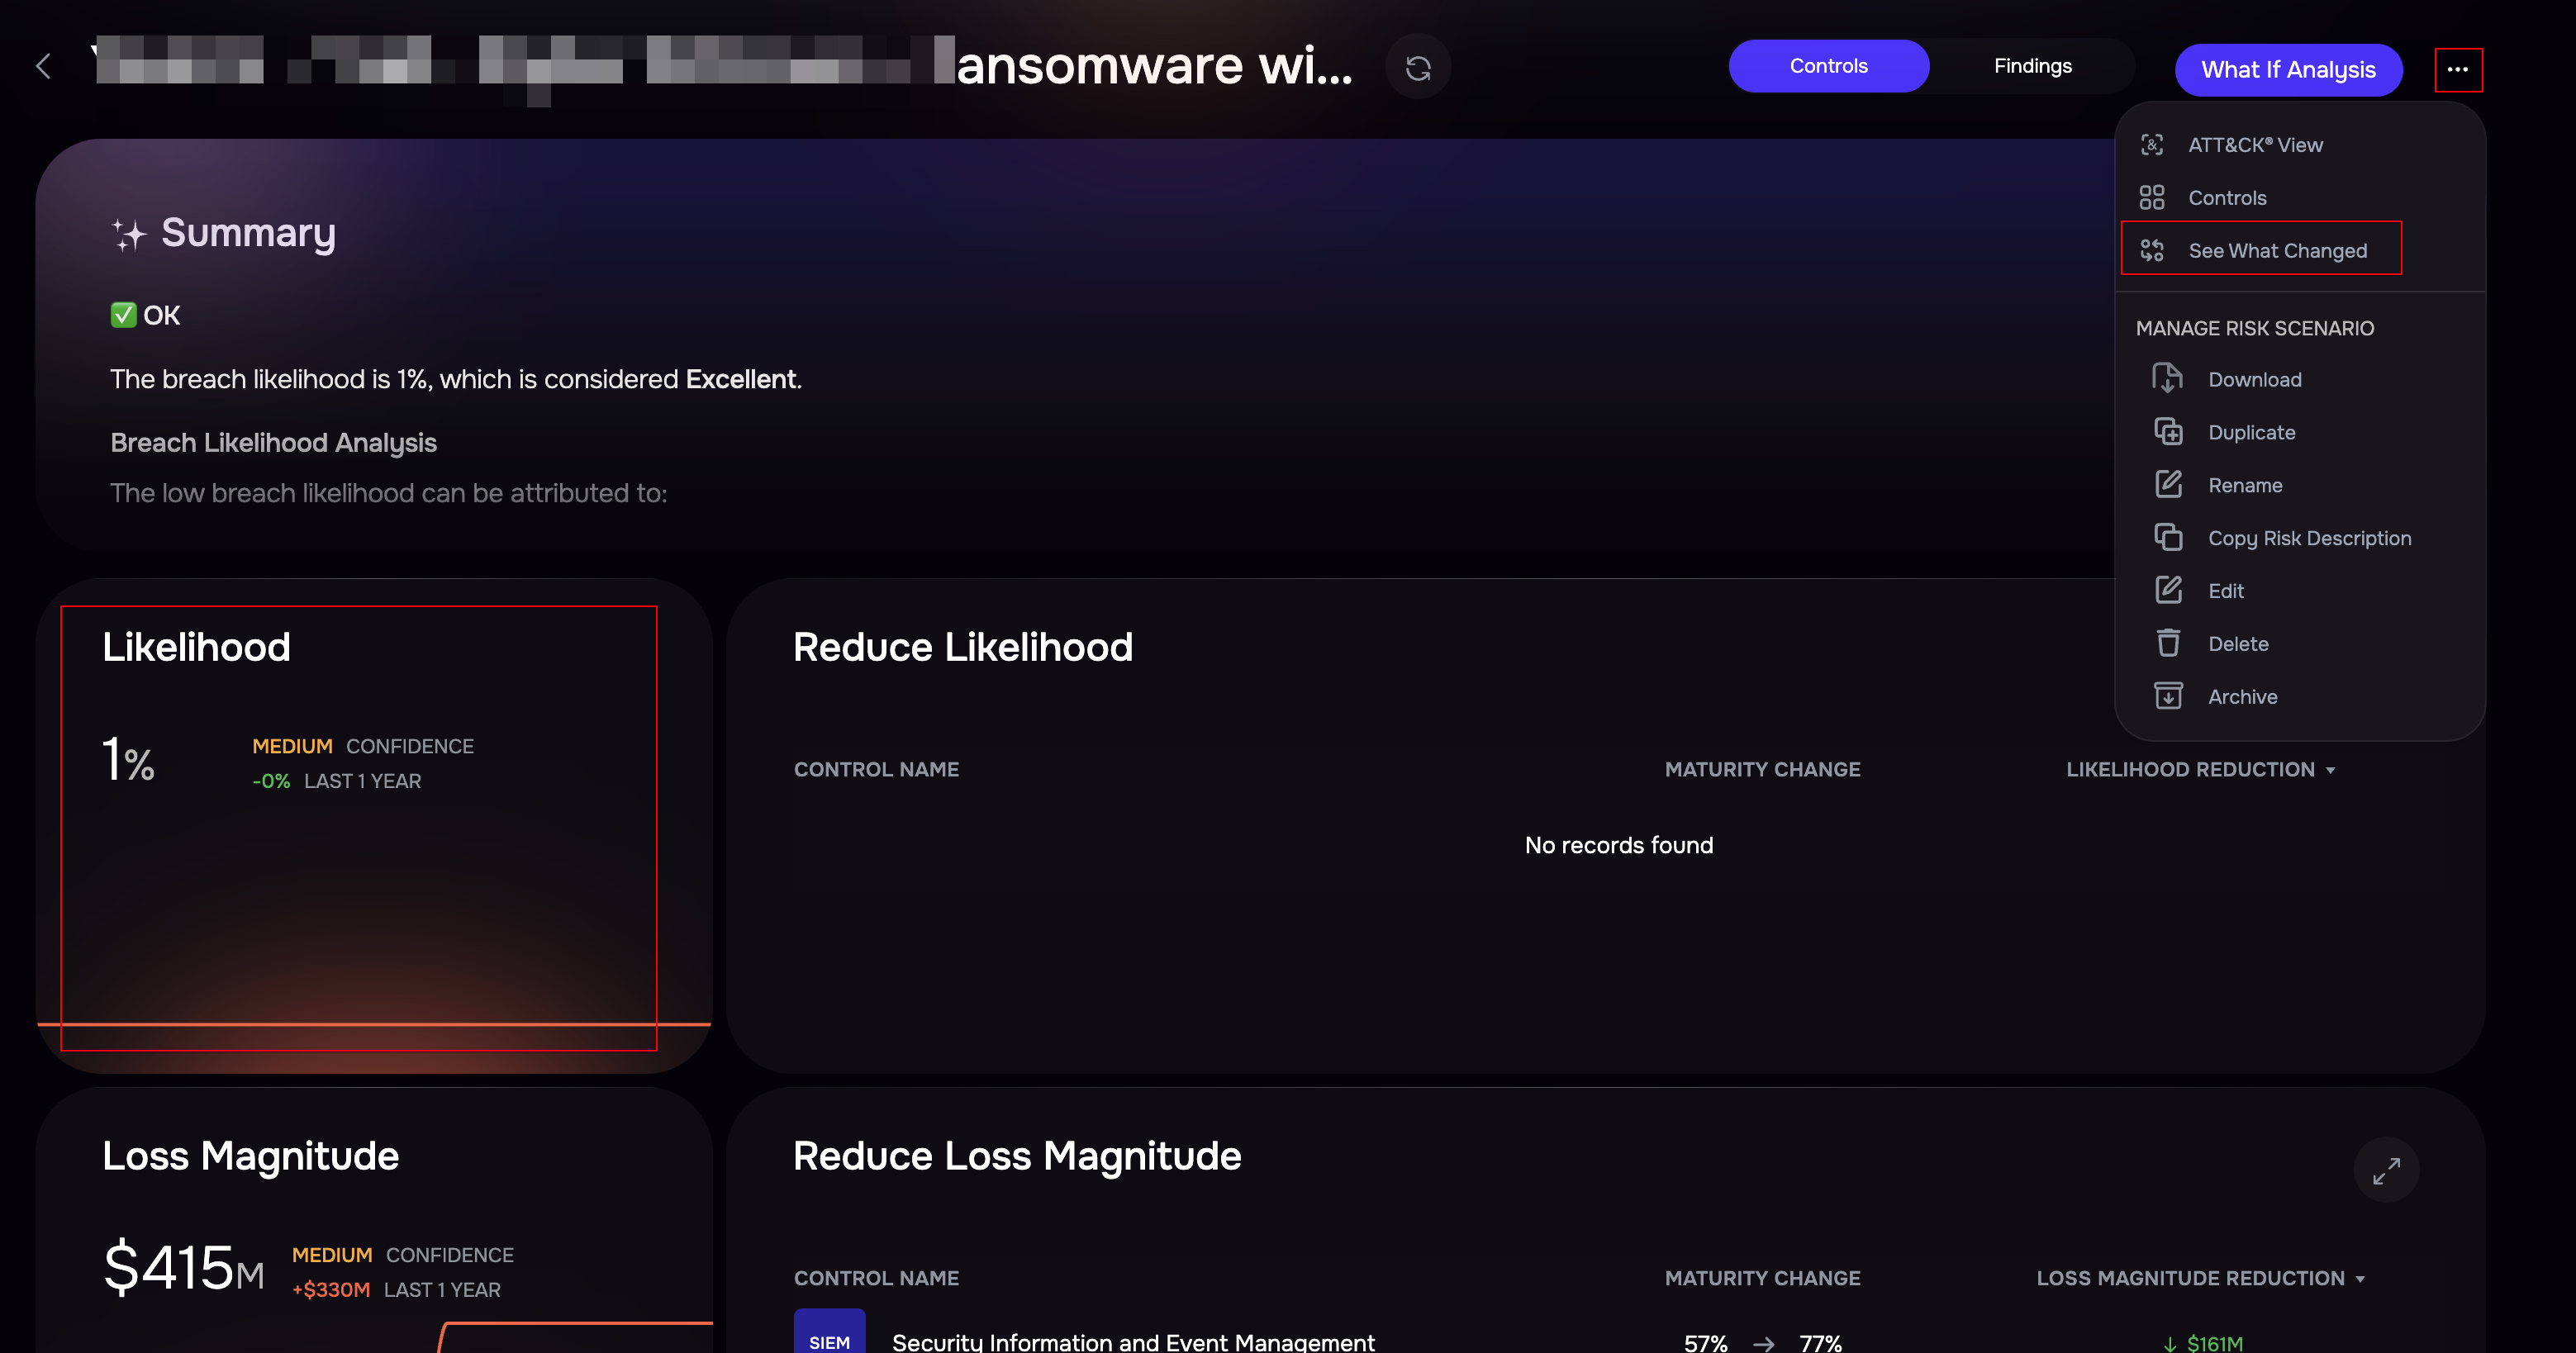
Via three-dot options Menu: Click the three-dot icon on the top-right corner of the Risk Scenario page and select "See What Changed" from the dropdown menu.
Understanding the "See What Changed" Dashboard
The dashboard provides a comprehensive view of changes in your cyber risk environment. You can analyze variations over different timeframes, ranging from 1 day to 1 year, by selecting the date filter on the right-hand side.
The dashboard consists of multiple sections, each focusing on different aspects of risk evolution.
Overall Risk Trend
This section displays the visual graphs depicting trends in:
Risk Likelihood
Loss Magnitude
Annualized Loss
Users can select different timeframes to observe historical variations and trends.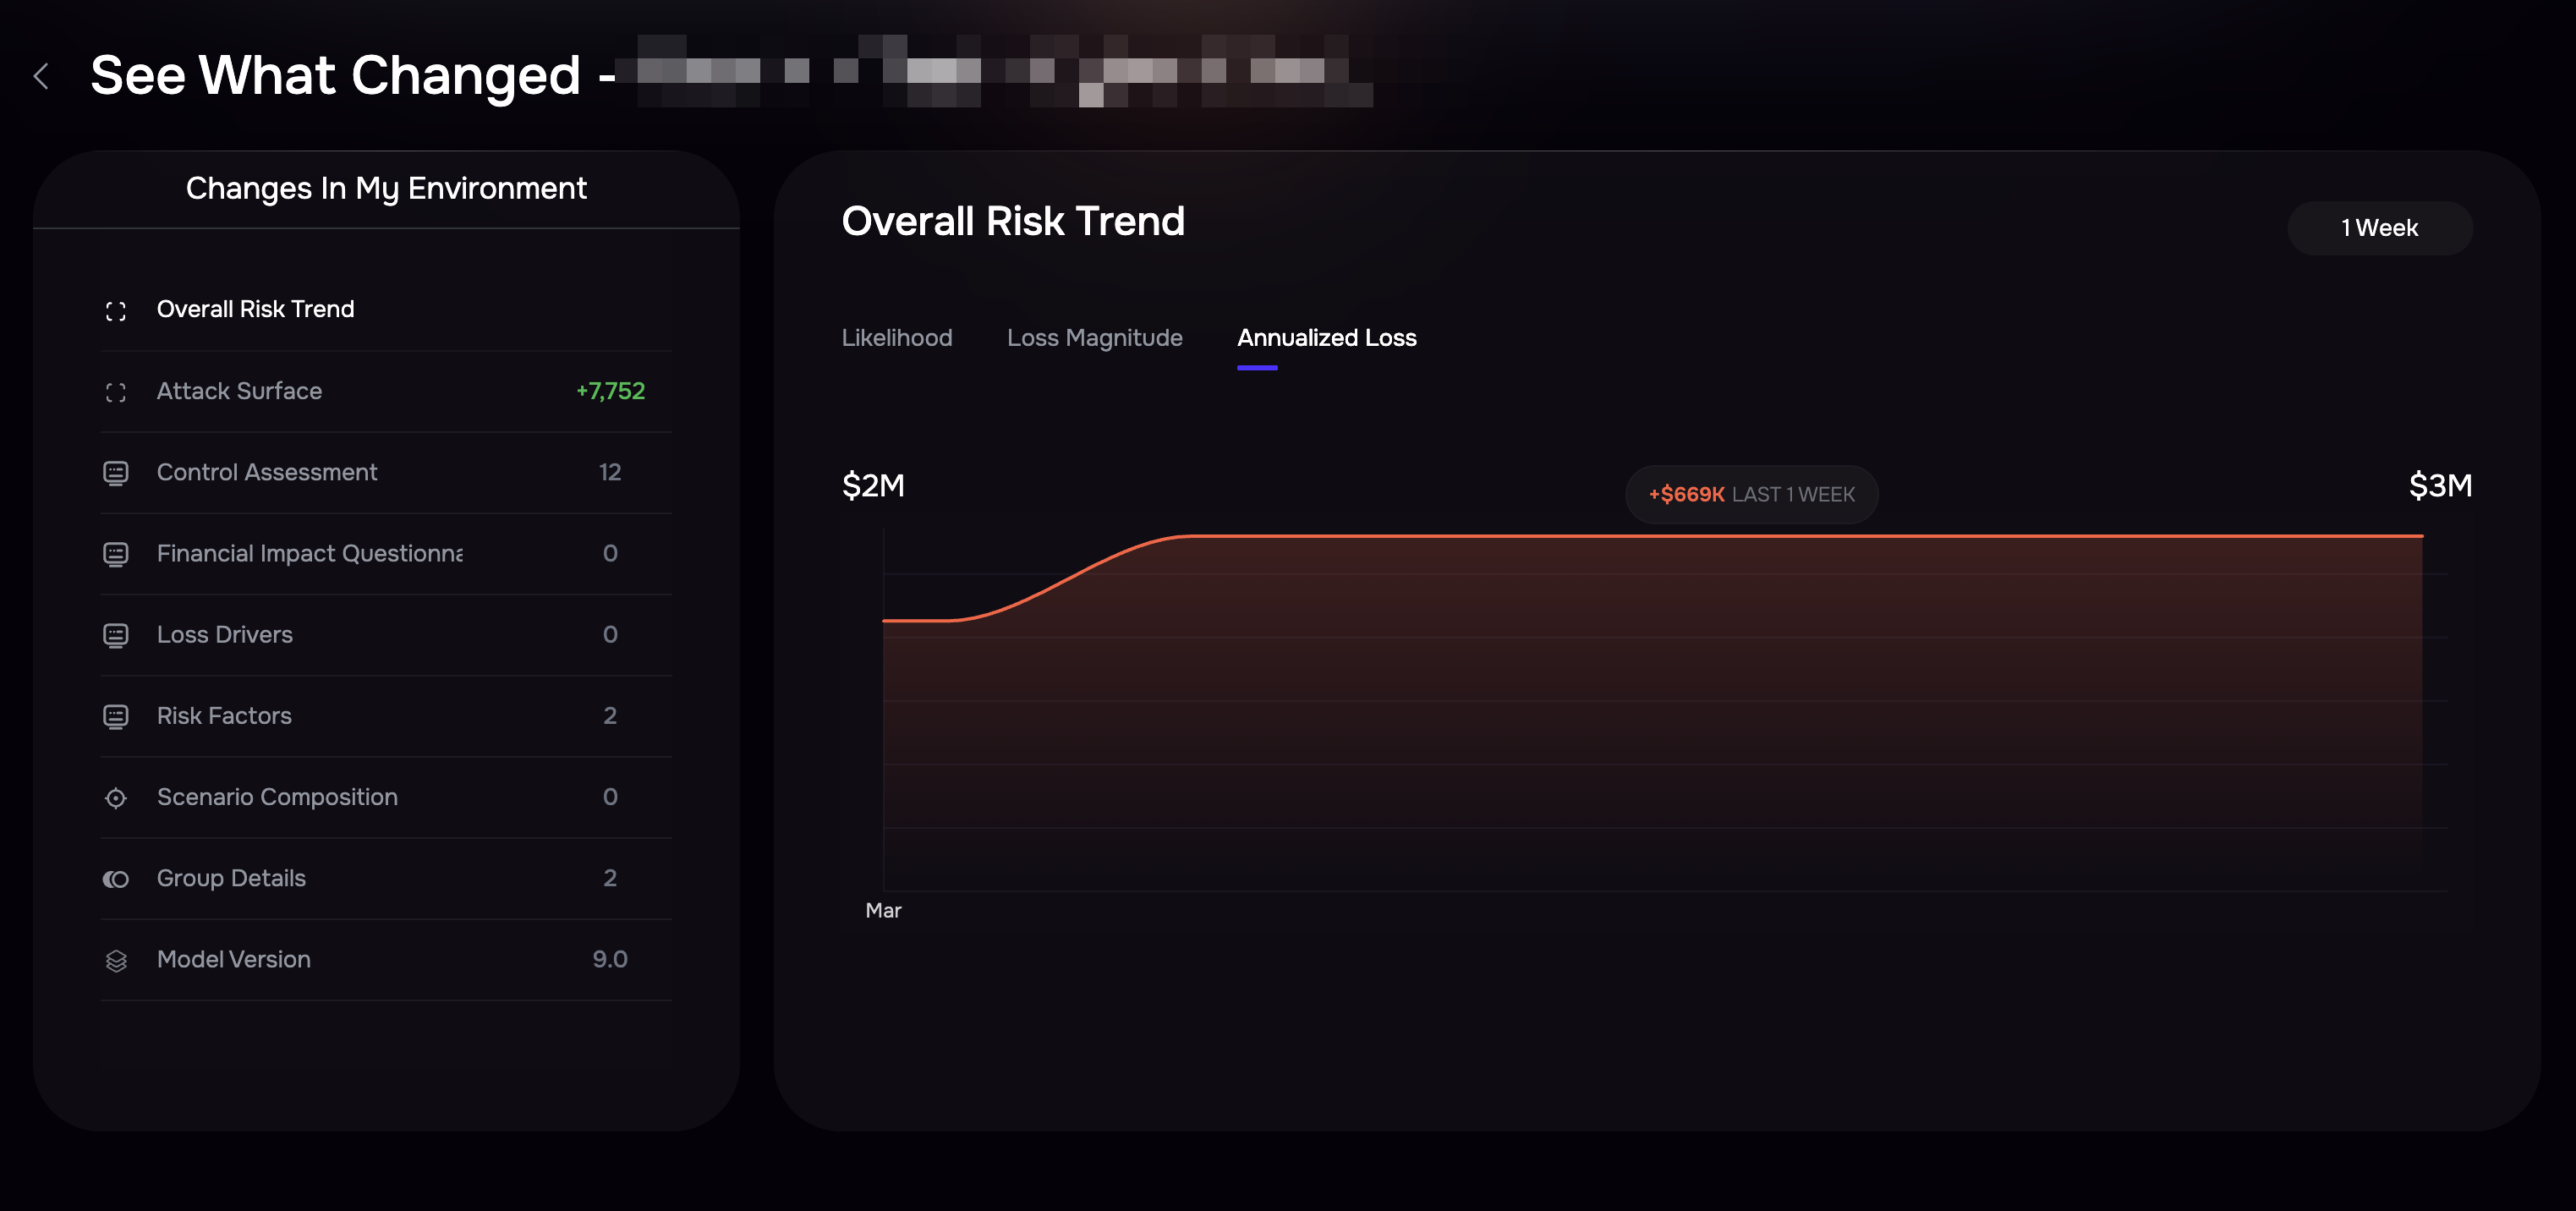
Changes in My Environment
Attack Surface: Tracks changes in the overall count of attack surfaces over the selected time period.
Control Assessment: Displays the number of security controls that have changed during the selected timeframe.
Financial Impact Questionnaire (FIQ): Highlights modifications in Financial Impact Questionnaires (FIQ), reflecting updates in potential financial risks.
Loss Drivers: Shows variations in identified loss drivers over time.
Risk Factors: Illustrates changes in Risk Factor Scores, providing insights into shifts in contributing risk elements.
Scenario Composition: Tracks modifications in the Risk Scenarios over the selected time period.
Group Details: Monitors updates to defined groups, ensuring visibility into organizational or asset-based changes.
Model Version: Displays updates to the FAIR-CAM model, ensuring users are aware of any modifications in the risk assessment methodology.