- 5 Minutes to read
- Print
- PDF
Understanding Risk Scenario Details Page
- 5 Minutes to read
- Print
- PDF
Risk Scenario
The Risk Scenario page has many features to help you understand your risk and manage them easily. Let's break down each feature so you can use them effectively.
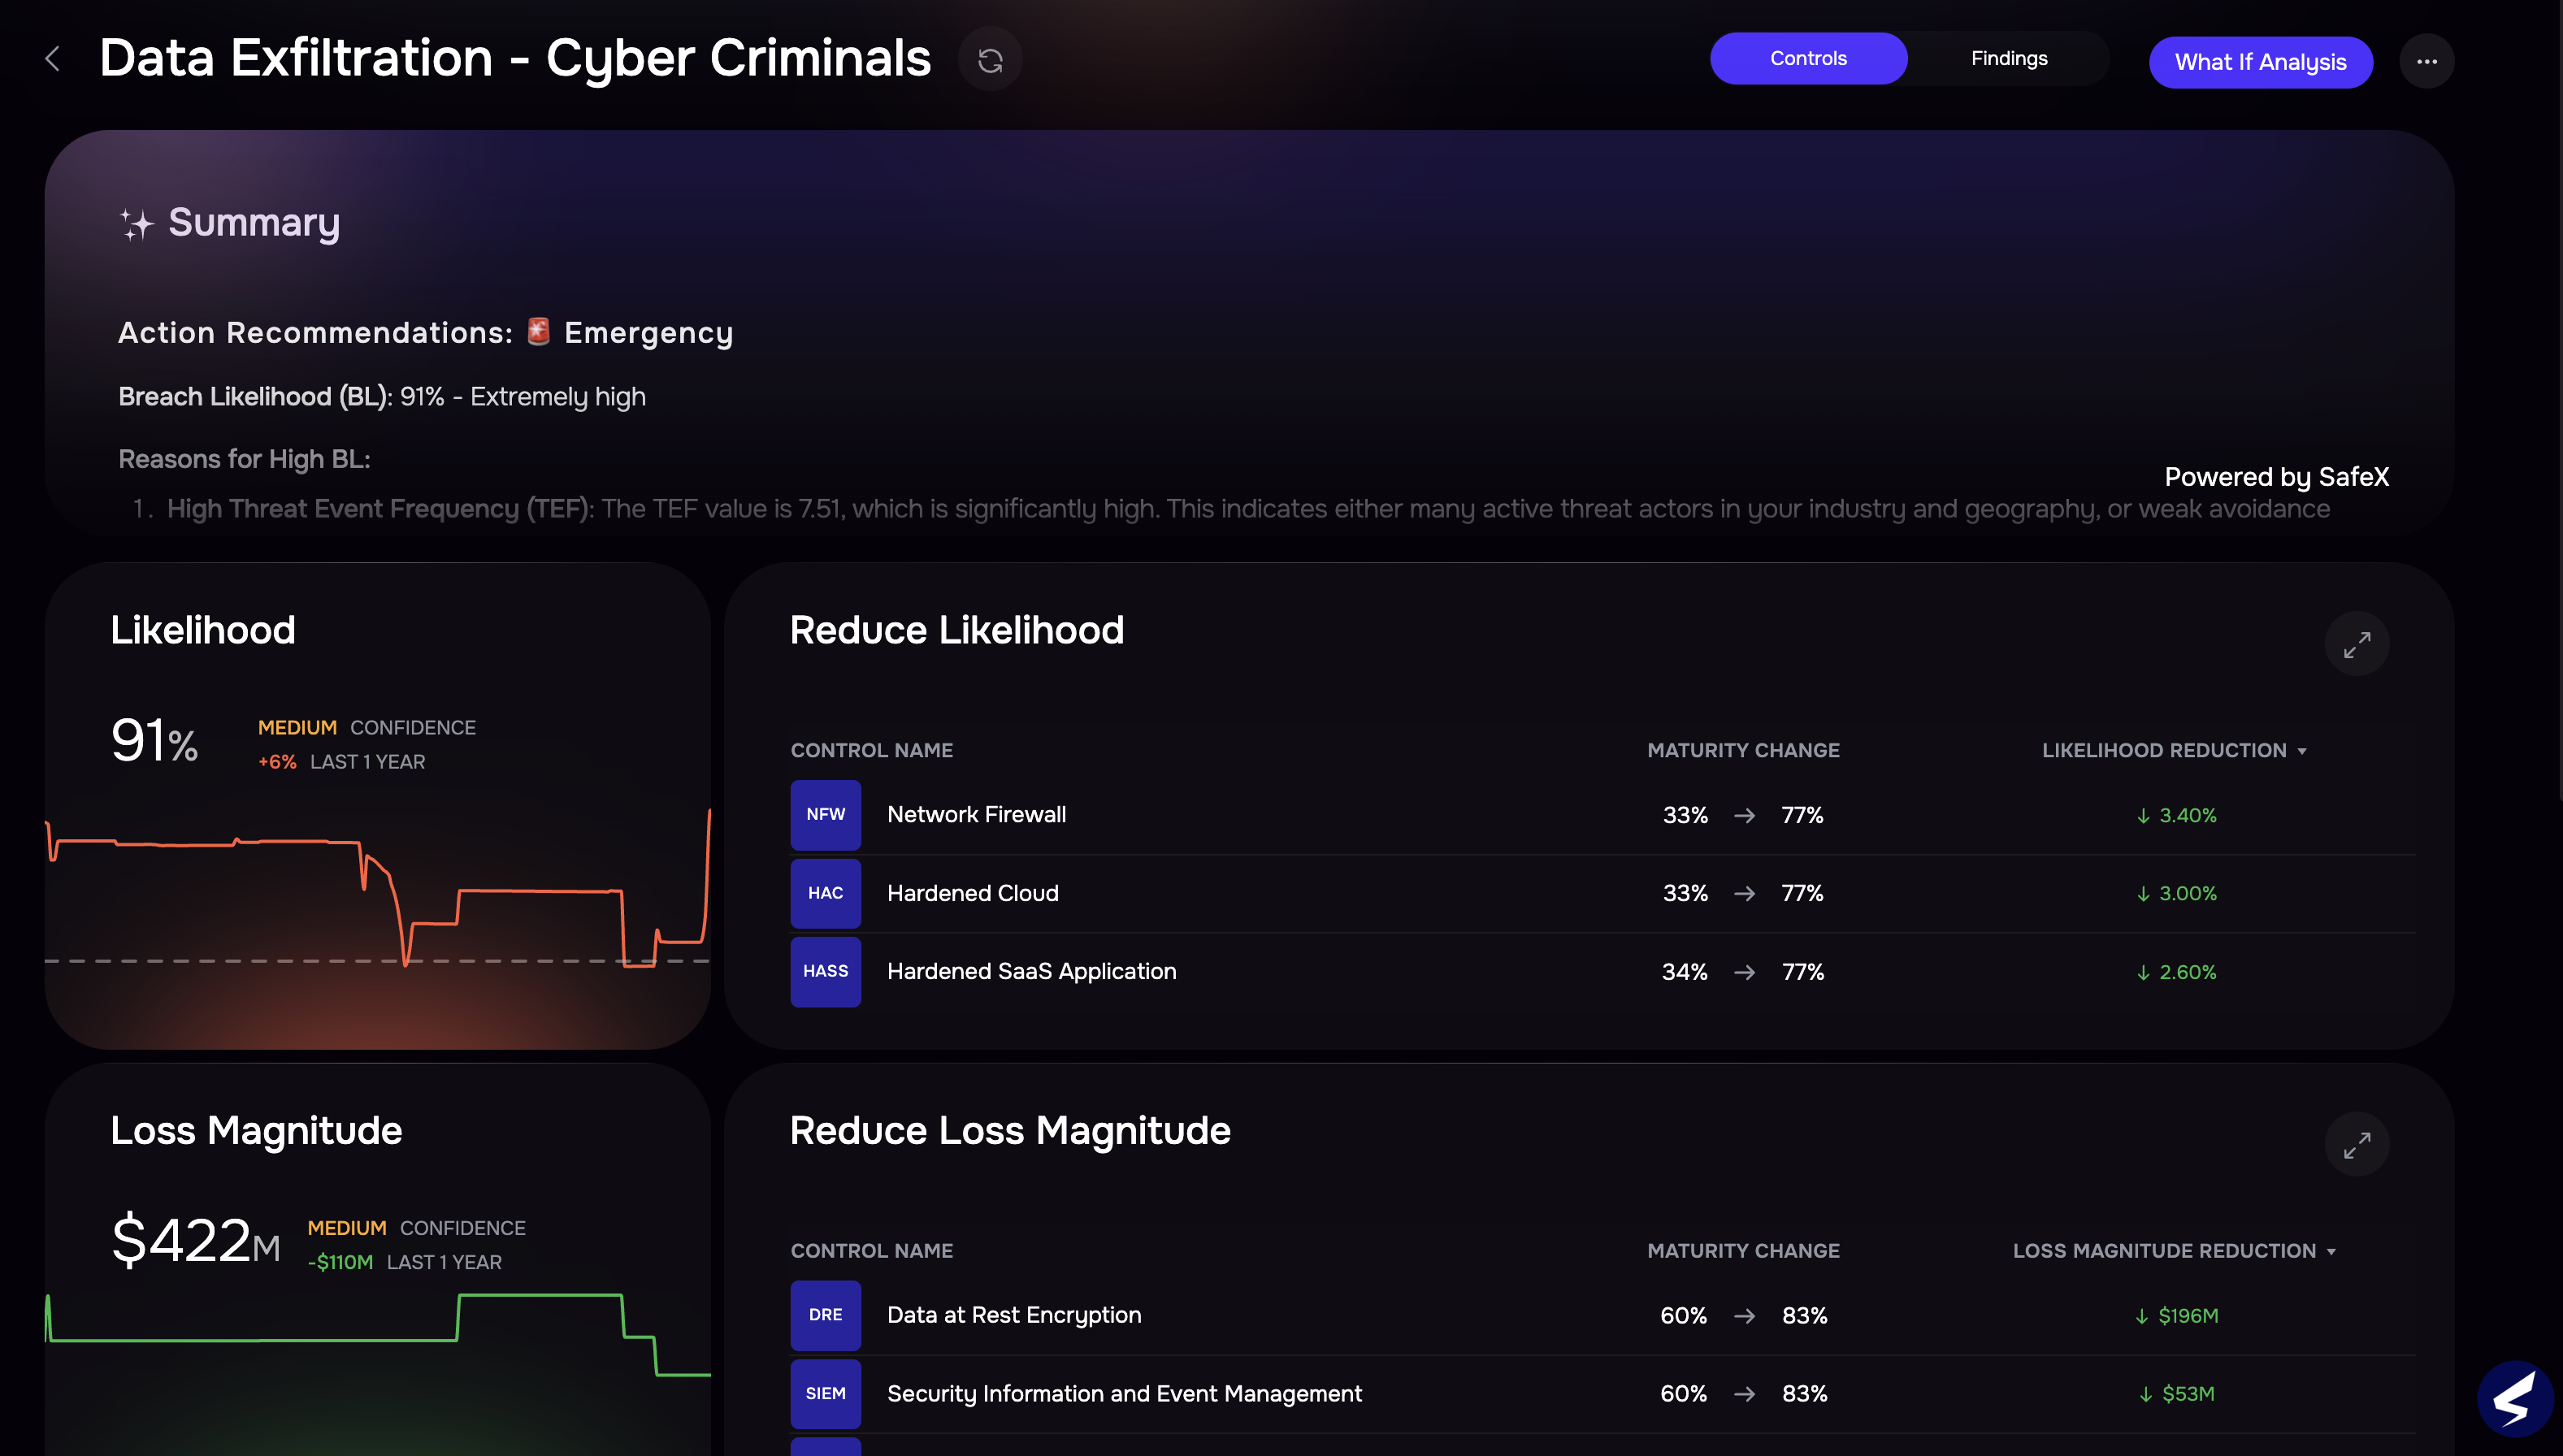
Likelihood widget
This widget in the left-hand side shows you the current likelihood score of your risk along with the graph. Hover on it to see the changes in the last 1 year.
Key Features:
Numerical Score: Represents the probability of the risk occurring
Visual Graph: Provides a quick visual representation of the likelihood trend
Historical Data: Hover over the graph to see changes over the last year
How to use?
Observe the current likelihood score
Analyze the trend line in the graph
Hover over different points to understand historical fluctuations
Use this information to identify periods of increased or decreased risk likelihood
Loss Magnitude Widget
Loss Magnitude widget
This widget in the left-hand side shows you the potential financial impact of the risk along with the graph. Hover on it to see the changes in the last 1 year.
Key Features:
Dollar Value: Represents the estimated financial loss if the risk occurs
Visual Graph: Illustrates the trend of potential loss over time
Historical Data: Hover functionality reveals changes over the past year
How to use?
Note the current loss magnitude in dollars
Examine the graph to identify any significant changes or patterns
Hover over specific points to view historical values
Use this data to understand how the potential financial impact has evolved
Annualized Loss Widget
Annualized Loss
This widget on the left-hand side displays you the expected annual financial loss of your risk along with the graph. Hover on it to see the changes in the last 1 year.
Key Features:
Dollar Value: Shows the annualized loss estimation
Visual Graph: Represents the trend of annualized loss over time
Historical Data: Hover function reveals changes over the last year
How to use?
Review the current annualized loss figure
Analyze the graph to identify long-term trends
Use the hover function to explore historical data points
Compare this with the Loss Magnitude to understand the risk's frequency and severity
Risk Scenario Composition
Risk Scenario Composition gives you the additional details associated with the Risk like Total controls and Findings associated.
Key Features:
Total Controls: Displays the number of controls associated with the risk
Findings: Shows the number of findings related to the risk
Additional Details: May include risk owner, last update date, and other relevant information
How to use?
Review the number of controls to understand the breadth of risk management efforts
Check the number of findings to gauge the complexity of the risk scenario
Use additional details to get a comprehensive view of the risk context
Click on controls or findings for more detailed information
Risk Description
Controls Findings
What Are Controls?
Controls are measures your organization puts in place to reduce risks. On the Risk Scenario page, these controls affect two key areas:
Loss Magnitude: How much a risk could potentially cost.
Risk Likelihood: The chance of a risk actually happening.
For details, see What is FAIR-CAM?
Key features on Control Findings page
Maturity Change: Options to update how mature (effective) a control is.
Likelihood Reduction: Displays possible decreases in risk likelihood when control maturity is improved.
Loss Magnitude Reduction: Displays possible decreases in loss magnitude in terms of dollars when control maturity is improved.
How to Edit a Control?
Select a Control: Click on the control you want to change.
Control Details: On the left, you'll see information about the control, like what it does and who owns it.
Control Details: The left-side widget provides information such as:
Description: What the control does.
Questionnaires: List of related Questionnaires affecting the control.
Attack Surfaces: Areas covered by the control.
Integrations: List of Integrations from where the controls are coming from.
Control Owner: Name of the control owner who created the control.
Update Control Maturity:
On the right, use the Control Parameter section to adjust maturity. Simply, click Edit and you get the option to change the maturity of the Control. However, you need to understand the three distinct properties that result in the maturity of a control.
Capability: Capability refers to the ability of a control to effectively manage or mitigate the identified risks. It encompasses the functionality and specific operations that a control is designed to perform.
Coverage: Coverage indicates the extent to which a control addresses the identified risks across the organization. This includes the breadth and depth of the control's application.
Reliability: Reliability refers to the dependability of a control in consistently performing its intended function over time. This includes the assurance that the control will work as expected when needed.
To manually change Reliability, toggle Override.
Finalize Changes:
Change the maturity of the Control.
Enter the rationale for your change.
Click Save to apply changes.
Use Reset to restore default settings if needed.
Click See Rationale to view a log of all control maturity changes along with timestamps.
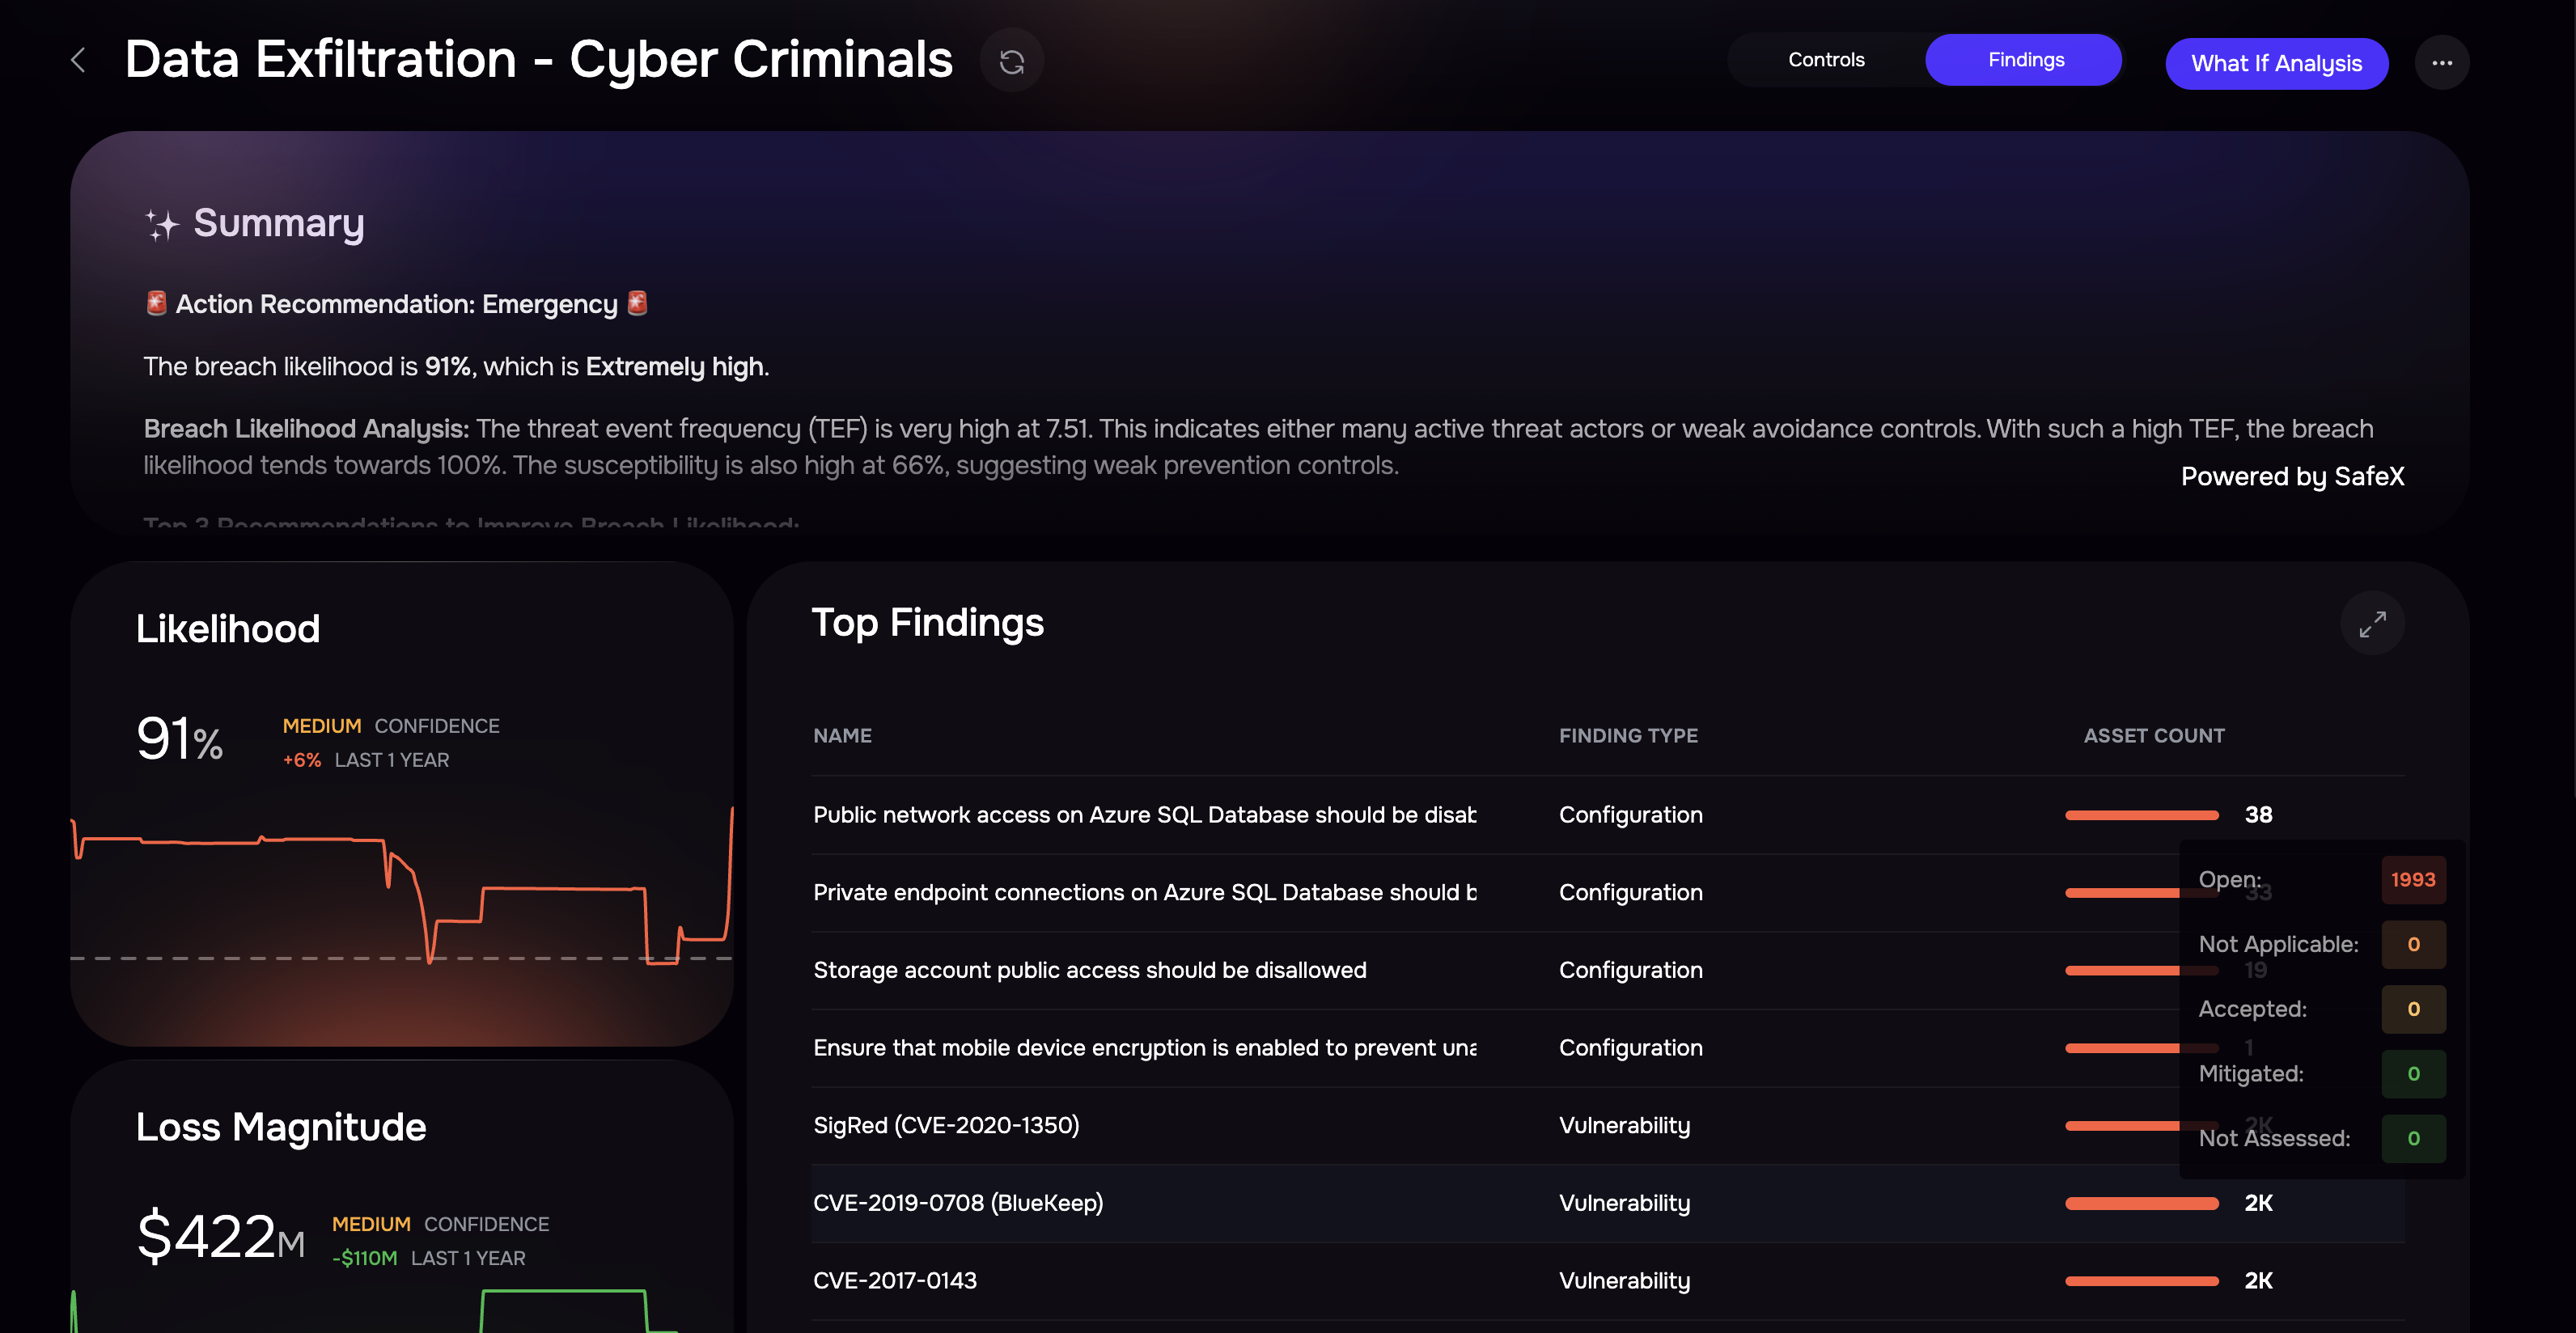
Findings
Findings are identified issues that influence Loss Magnitude and Risk Likelihood. Clicking Findings toggle to reveal the Findings page. The page highlights the Top 10 Findings that affect risks most significantly along with Finding Type and Asset Counts. Additionally, you can click View all Findings to display the list of all Findings.
How to Explore Findings?
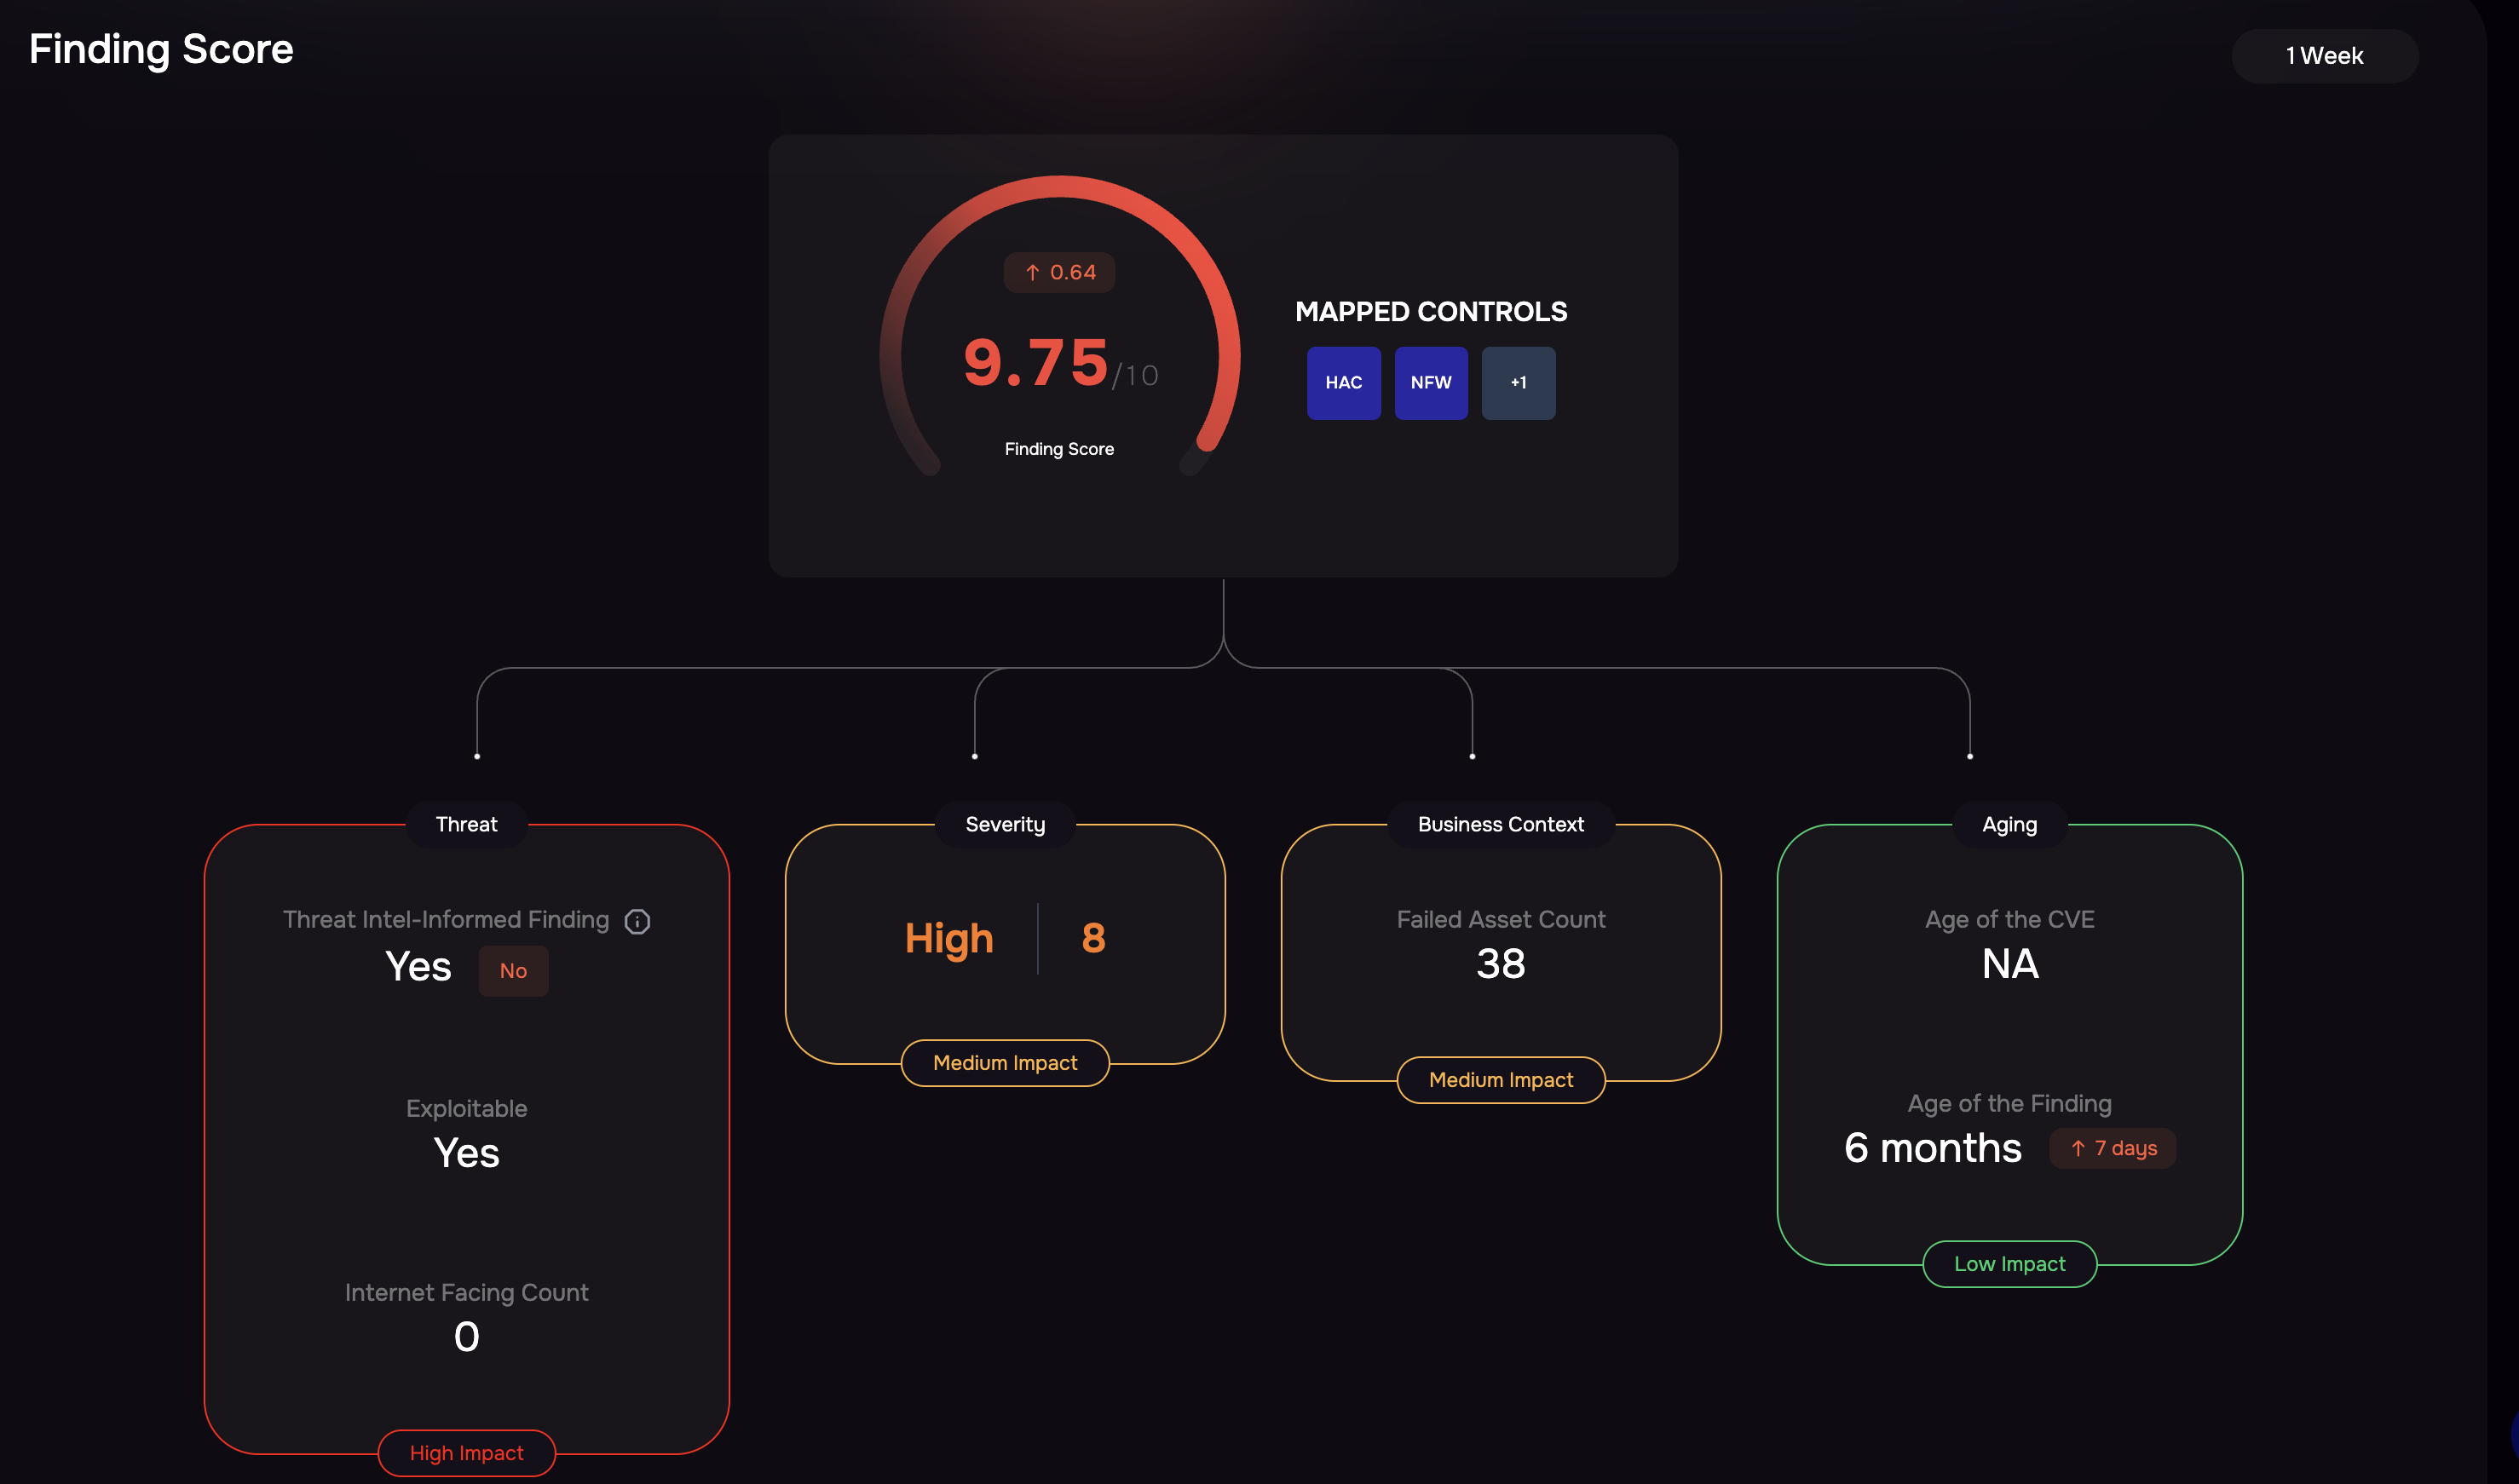
Select Findings: Click on Findings to visit the Finding Score page.
Review Finding Score page:
Your Finding scores are based on the following factors: These values combined together to make up your overall Finding score.
Threat
Aging
Business Context
Severity
Mapped Control: See the list of controls linked to this finding and how they affect your risk scores.
Additional Information:
Click See More for:
Remediation Suggestions
References link
Comments and Evidence
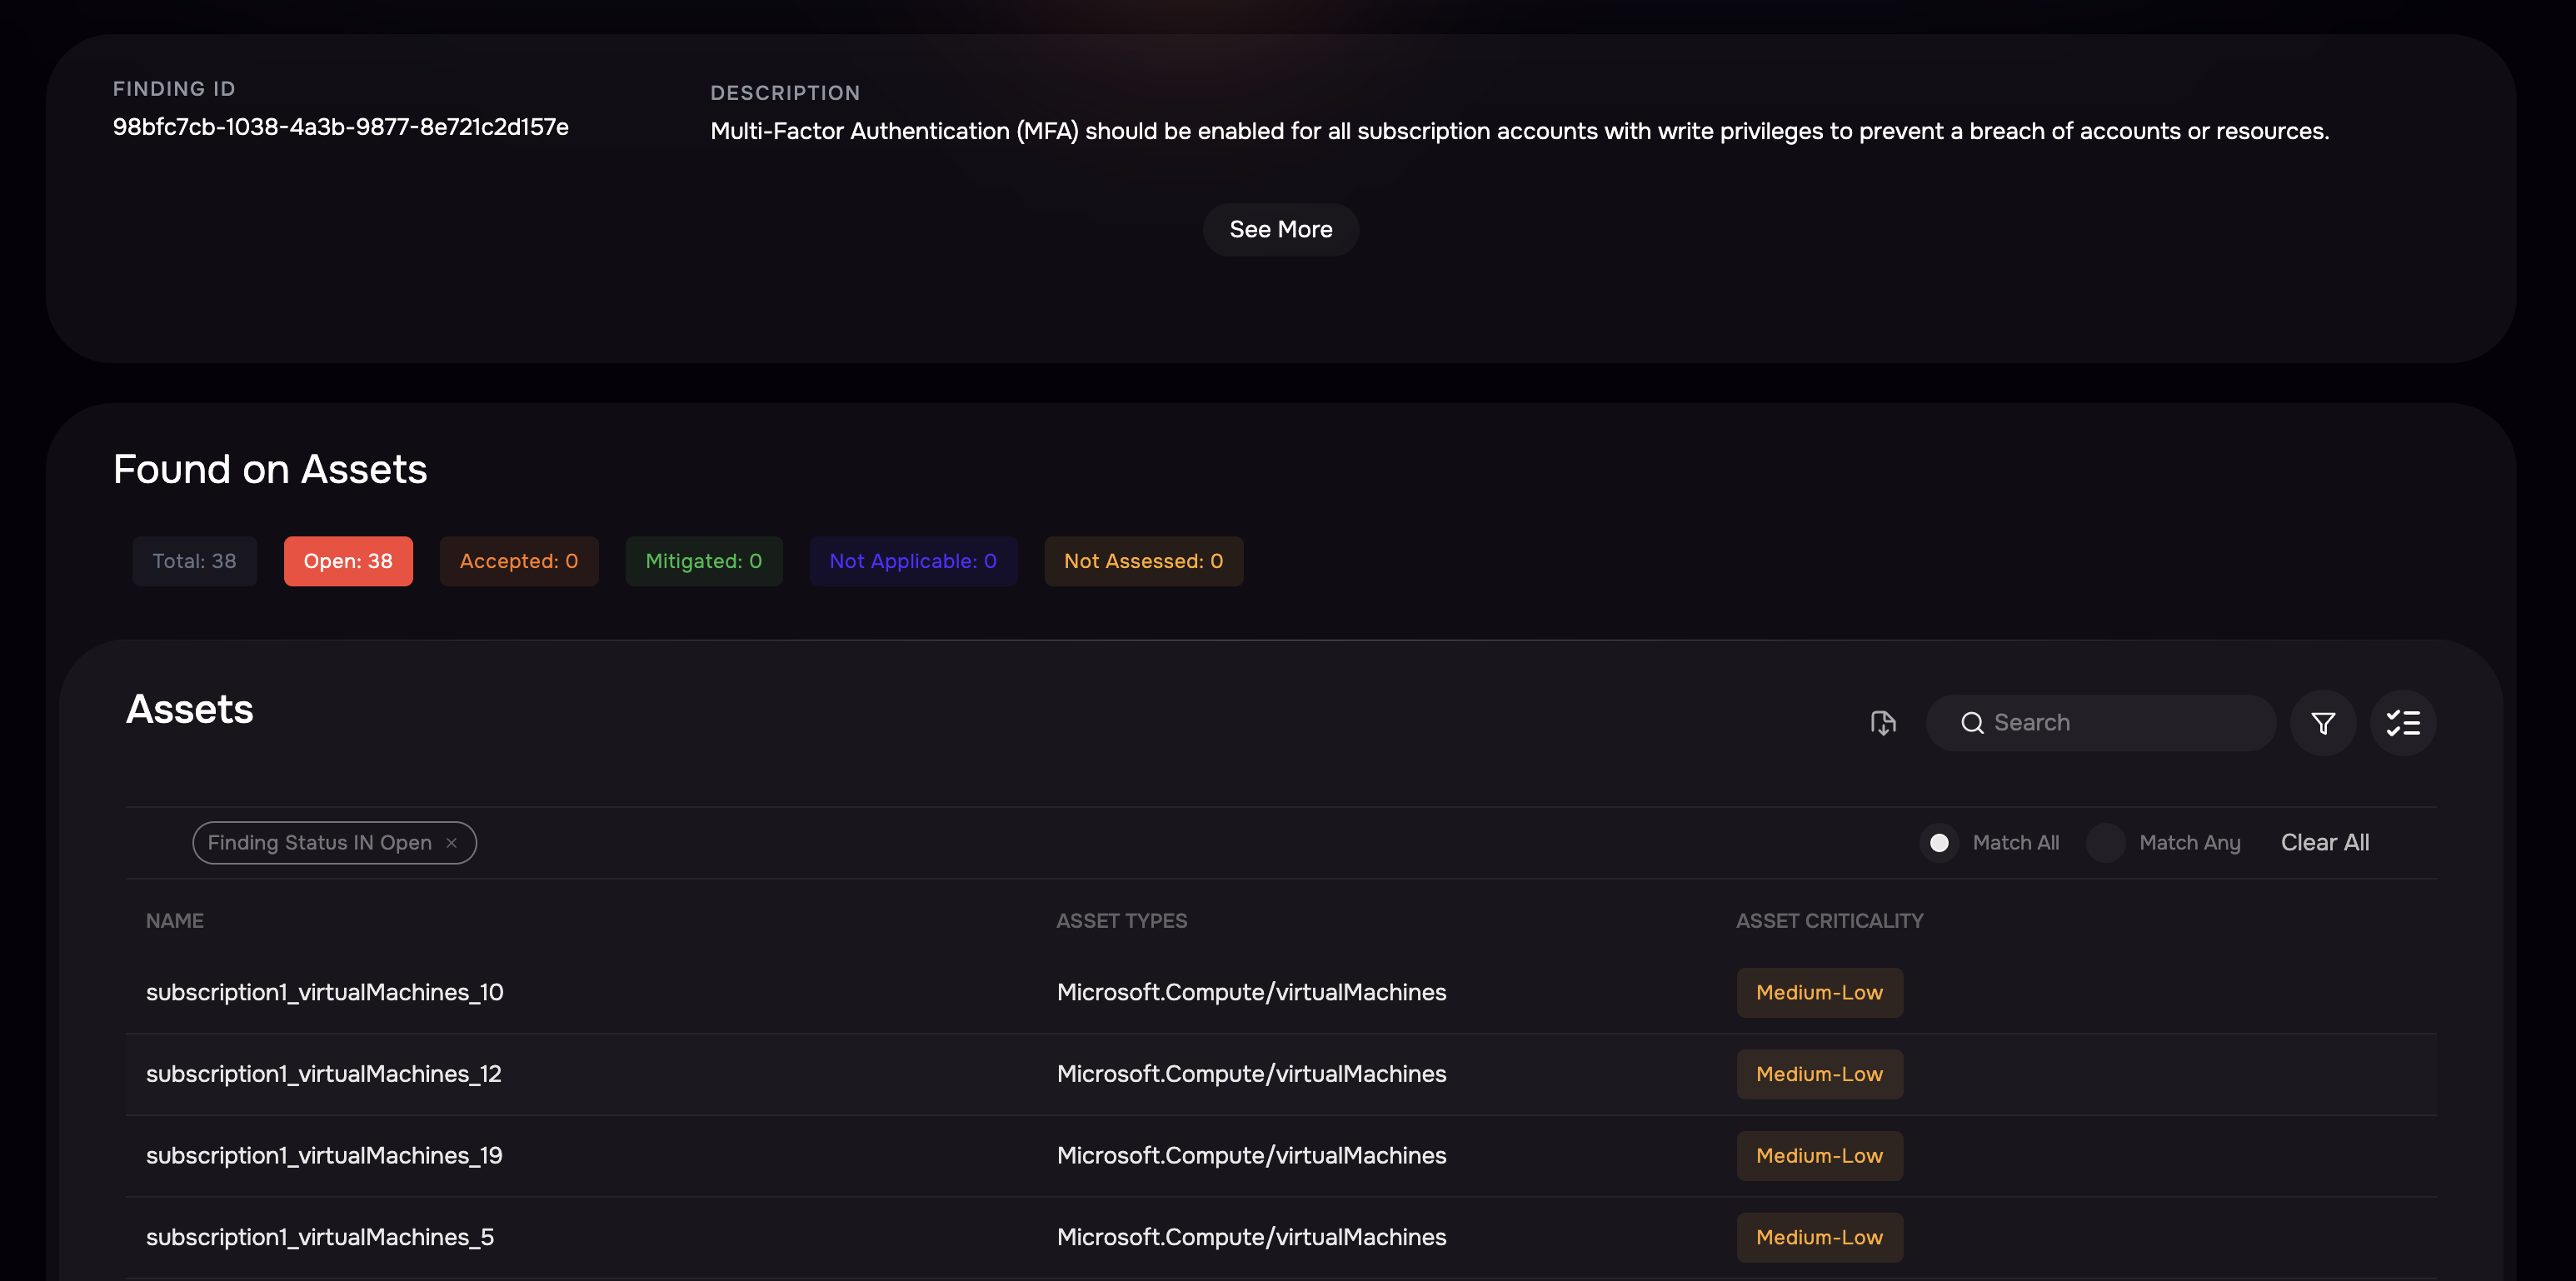
Found on Assets:
This section shows assets linked to selected findings. See which assets (like devices or software) are affected by the finding.
Use Match Any to filter and view specific Asset Findings.
Click the Download icon to export the report.
What-if Analysis
This feature helps you predict potential outcomes by simulating changes in control maturities.
How to Use What-if Analysis?
Initiate What-if: Click the What if Analysis button.
Examine FAIR Tree: Expand to see factors impacting Likelihood and Loss Magnitude.
Adjust Controls: Use dropdown menus to modify control maturities and observe changes in the tree map above to understand the impact of the changes.
Decide on Recommendations: Choose to Apply Recommendations or Reset changes as needed.
See What Changed
See What Changed helps you understand risk evolution over time.
How to Track Changes?
Access Changes: Click the See What Changed graph in the Risk Scenario page. Alternatively, you can also click the dot icon on top right to access the See What Changed menu.
Review Environment Changes:
The left side widget shows the Changes in My Environment options. Analyze changes over time, from 1 day up to 1 year by clicking on the date filter in the right hand side.
In the left hand side, you have the following options:
Overall Risk Trend: Visual Graphs for Risk Likelihood, Loss Magnitude, and Annualized Loss trends over the selected time period.
Attack Surface: Overall attack surfaces count over the selected time period.
Control Assessment: Changed controls count over the selected time period.
Financial Impact Questionnaire: Changes in FIQ over the selected time period.
Loss Drivers: Changes in Loss drivers over the selected time period.
Risk Factors: Changes in Risk Factor score over the selected time period.
Scenario Composition: Changes in Risk Scenarios over the selected time period.
Group Definition: Changes in groups over the selected time period..
Model Version: Updates in the FAIR CAM model.