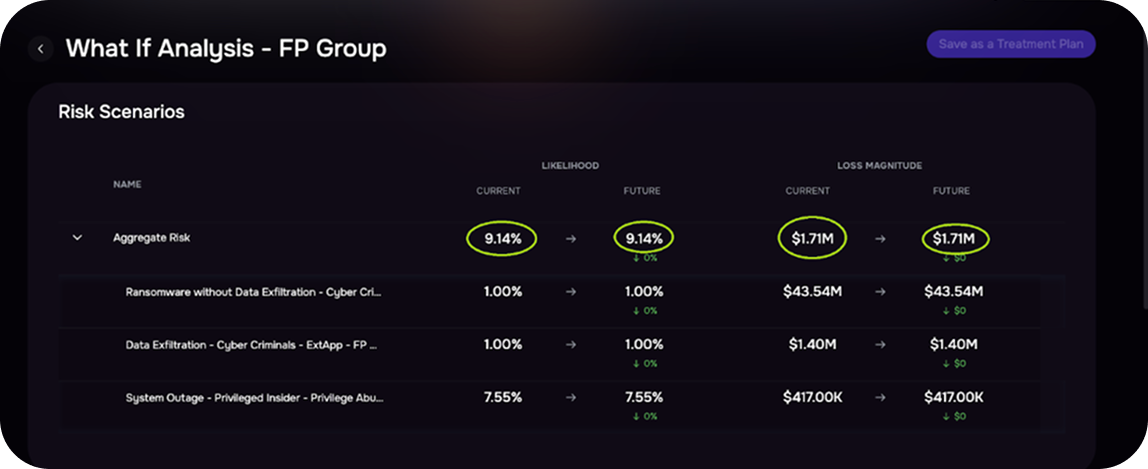
Release Notes | Release v4.1.110July 28, 2025 1. Improved Precision for Likelihood, Loss Magnitude, and ALEBased on your feedback, SAFE’s UI now displays values such as Likelihood, Loss Magnitude, and ALE with enhanced precision, up to two decimal places or smart rounding with rollover. This is a visual refinement only and does not affect the underlying scoring model or any of your existing risk treatment plans.
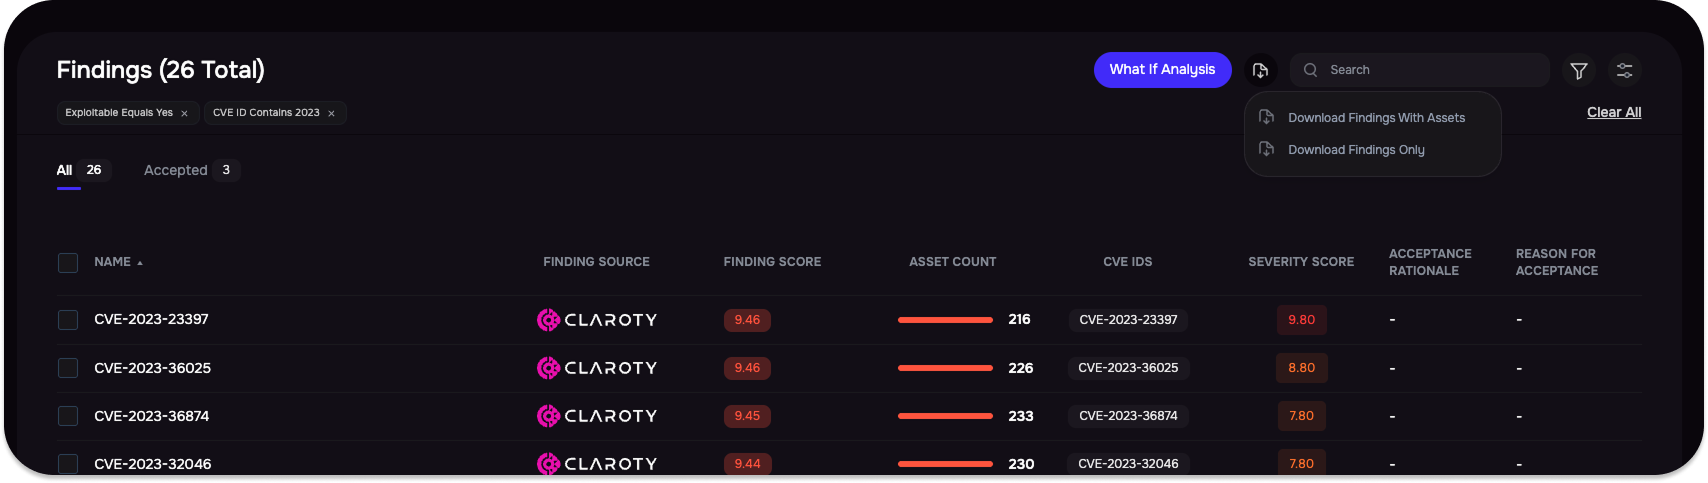
2. Support for Custom Fields in VA Report UploadSAFE now supports custom fields during VA report CSV uploads. First, create the required custom fields (e.g., Business Unit, Environment) in SAFE. Matching column headers in your CSV will automatically populate these fields for each finding. 3. Export Filtered List of Findings with Remediation GuidelinesSAFE now supports exporting filtered findings from the Findings Center. “Download Findings with Assets” includes associated assets and remediation guidelines, while “Download Findings Only” exports just the findings with remediations.
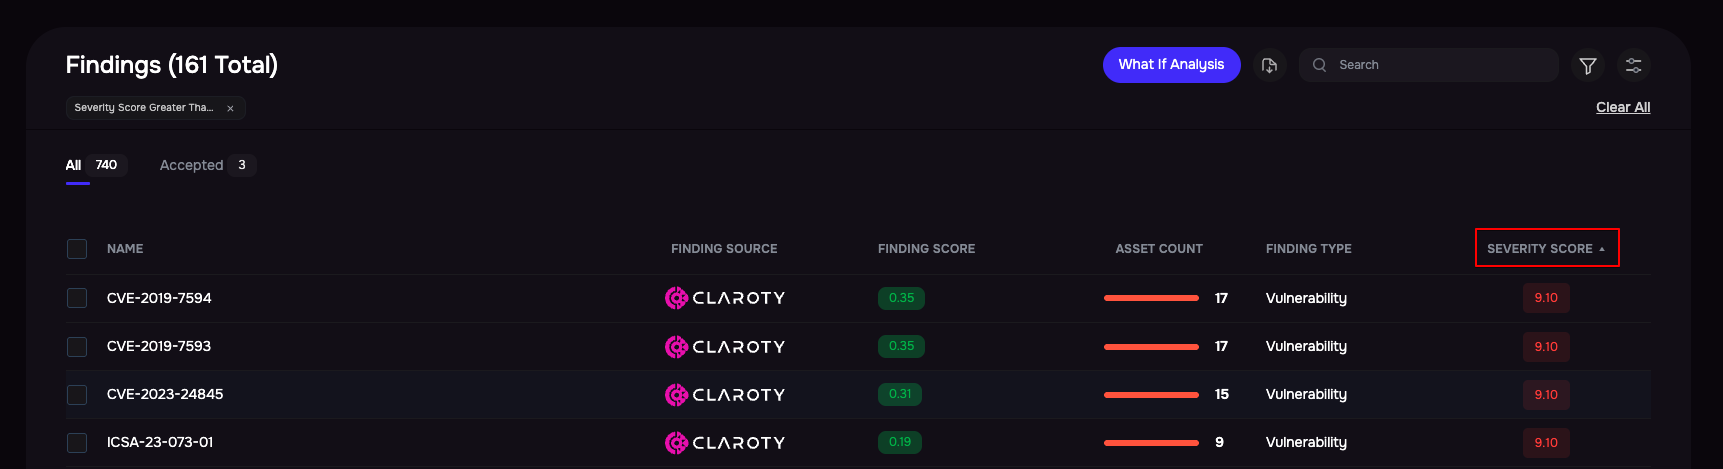
4. Severity Score in Findings ListSAFE now allows Severity Score as columns in the Findings List and supports filtering based on this.
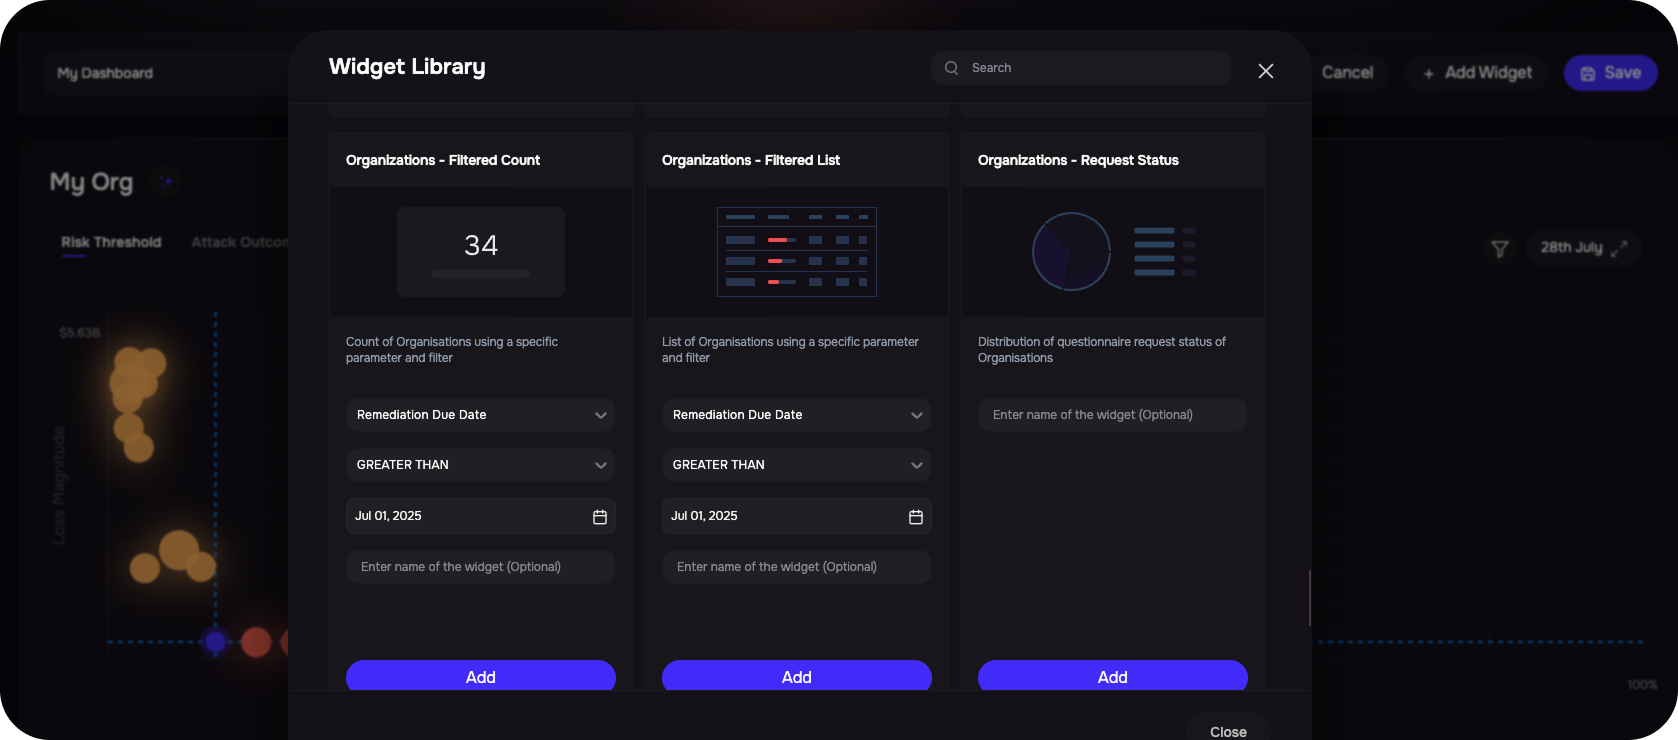
5. Date-Type Custom Fields in Dashboard WidgetsSupport has been added for dashboard widgets using date-type custom fields for Organizations, including Distribution, Filtered Count, and Filtered List views.
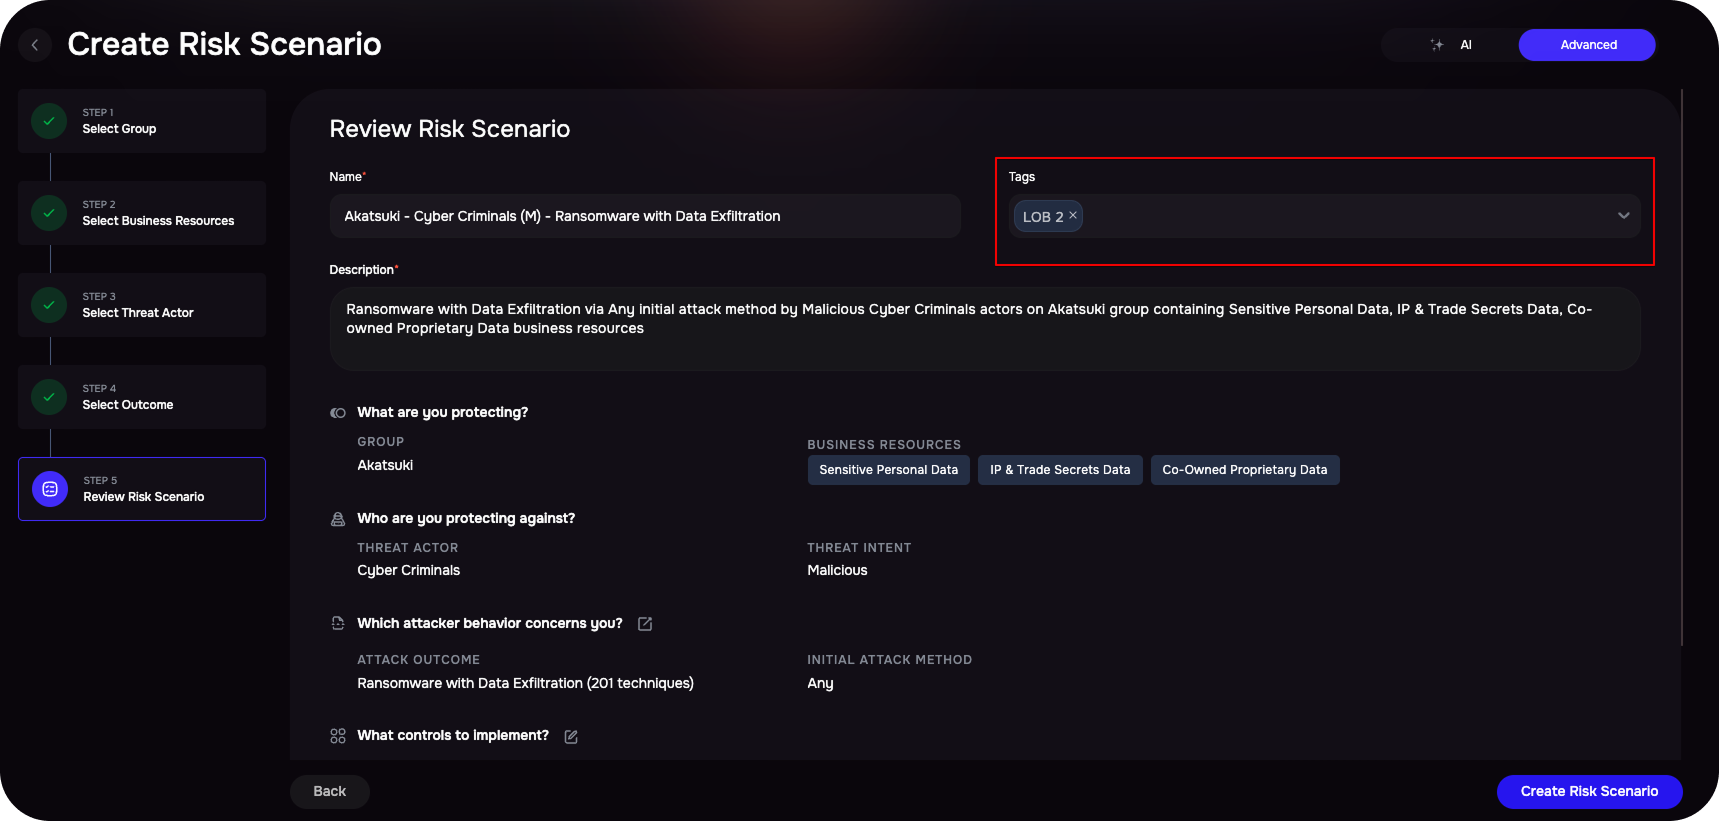
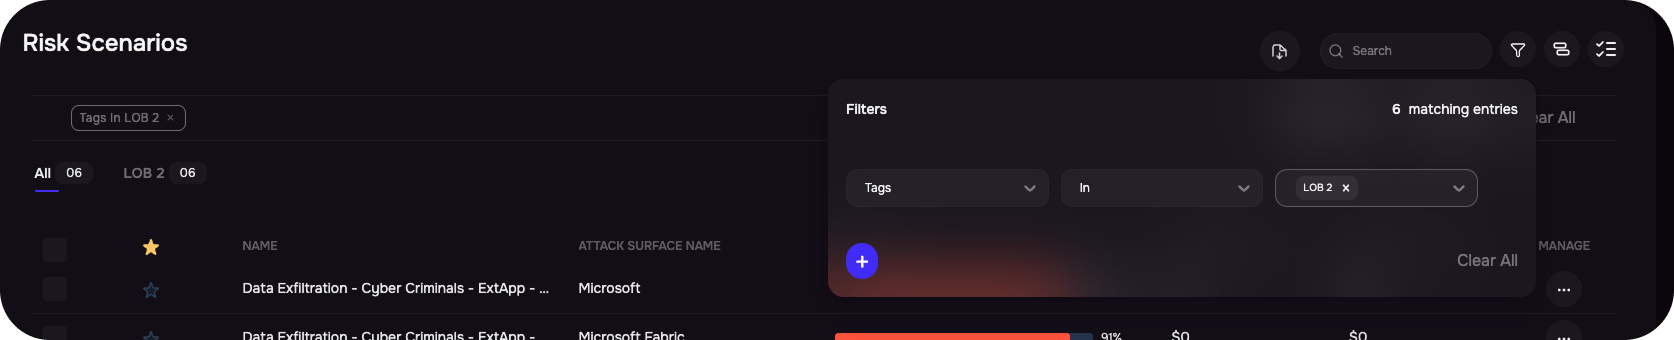
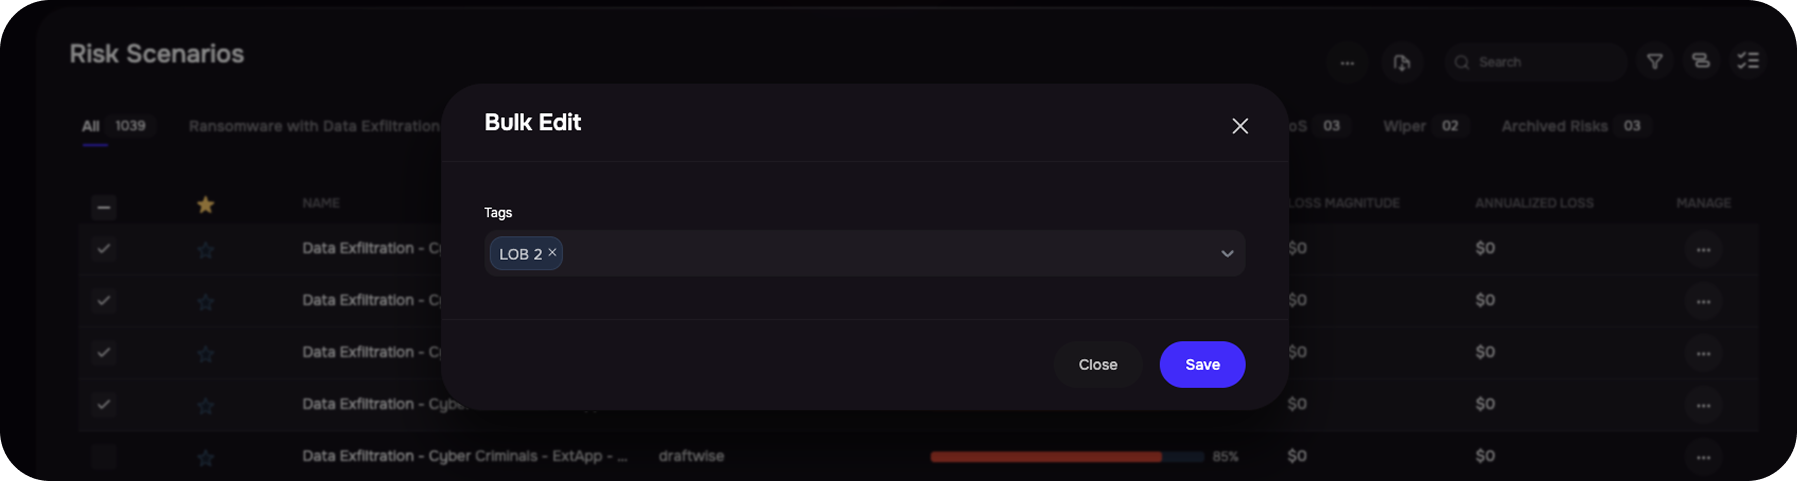
Release v4.1.109July 14, 2025 1. Organize and Visualize Risk Scenarios with TagsWe’ve introduced the ability to tag individual risk scenarios, making it easier to organize, analyze, and report on them by categories such as Business Units or Functions. With this update, users can:
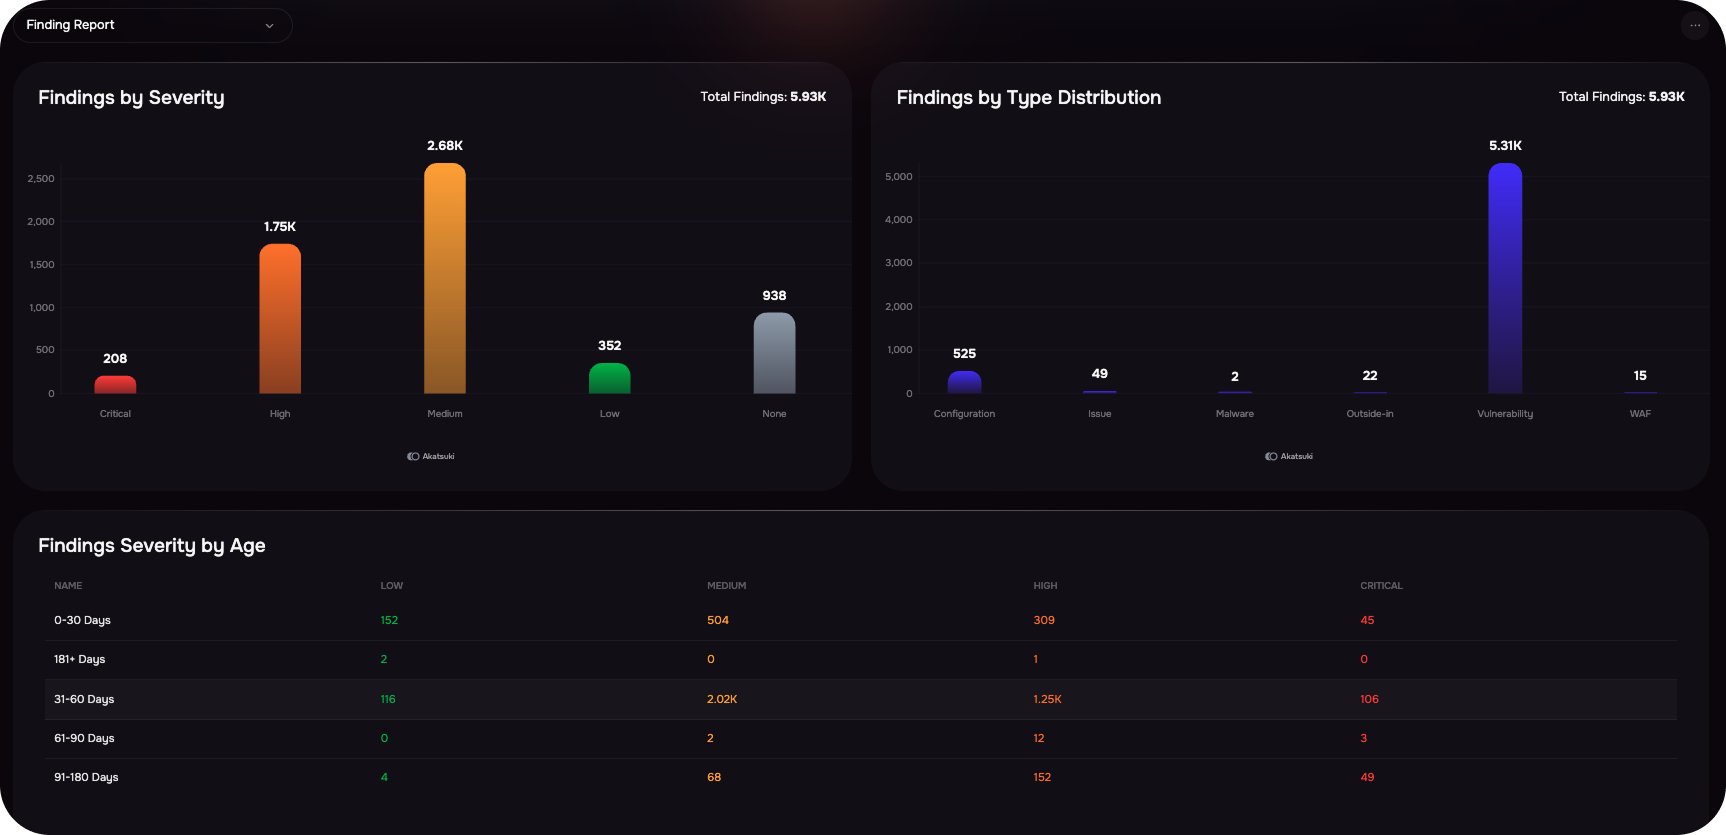
2. New Dashboard Widgets for Findings ReportingWe’ve added a set of new dashboard widgets to enhance findings reporting and visibility. Users can now track and analyze vulnerabilities with widgets like Findings by Severity, Age, Type, Severity by Age, and Top Findings by Source. These widgets provide real-time, group-filtered insights to help prioritize risks, monitor aging issues, and highlight high-impact findings across tools like Wiz and Tenable.
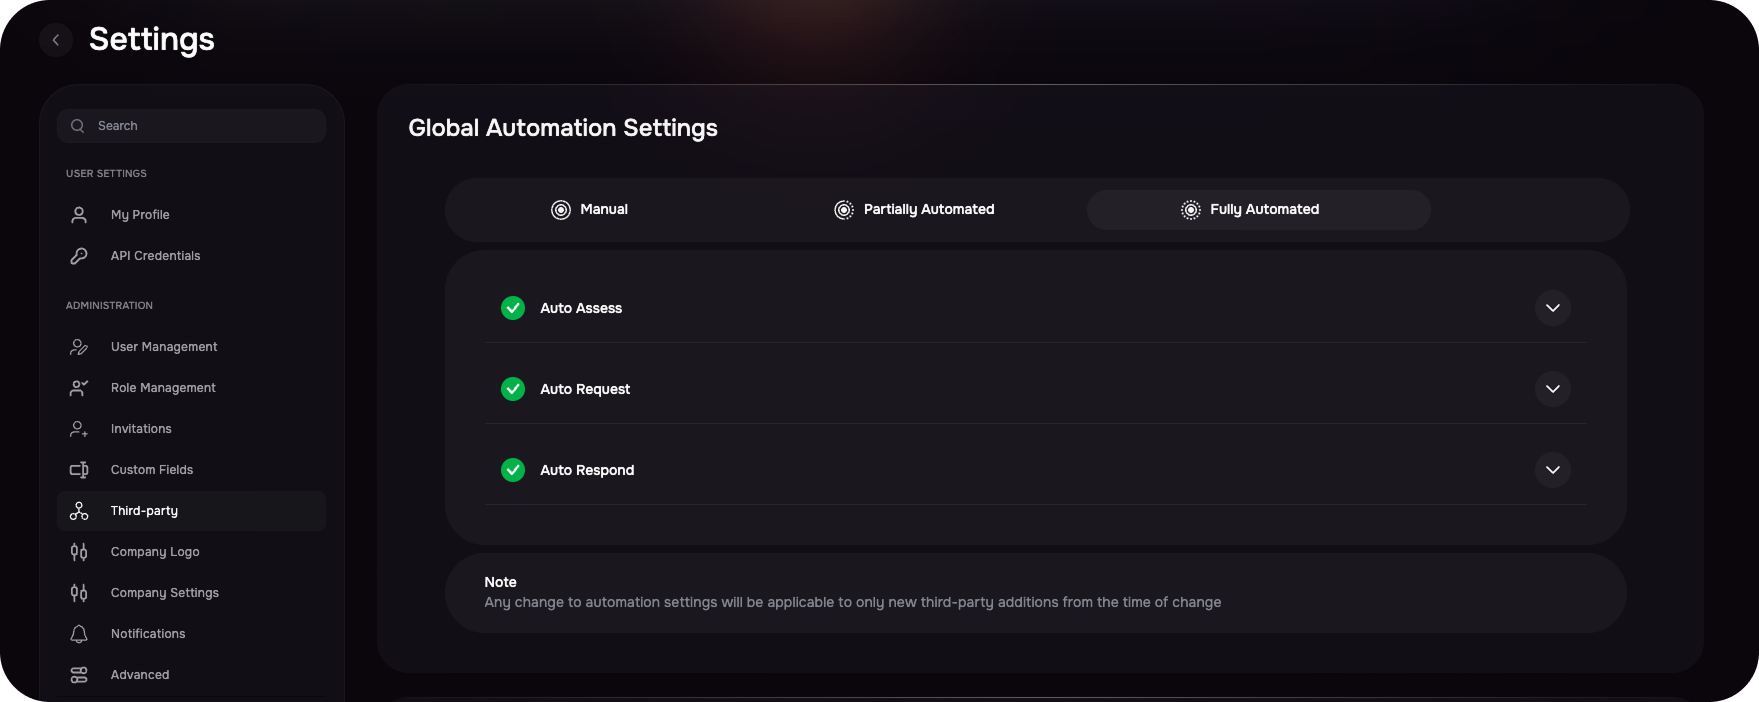
3. Global Automation Settings for Third-PartyWe’ve introduced a Global Automation Settings section in the Third-Party Settings to simplify and streamline how automation behaves across third-party workflows. Users can now toggle between three automation modes – Manual, Partially Automated, and Fully Automated – to better align with their organization’s third-party risk management strategies.
4. Outside-In Finding ObservationsOutside-In assessments now display raw observation details linked to each asset, improving transparency into Findings. This enhancement helps users understand the origin of findings more clearly. Note: Observation details will be updated during the next scheduled assessment, expected within the next 15 days.
5. Threat Center Updated
|
.png)