You can find these options in the Assets menu.
What You Can Do Here
Monitor total asset visibility using the Analyzed Assets and Analyzed Assets by Data Source metrics.
Evaluate device-level insights through Analyzed Assets Telemetry.
Identify exposed assets using the Analyzed Assets with Exposures view.
Filter asset data using the Add Filter and Advanced Filters options.
Tag assets for categorization using the Tag control.
Modify asset classification via the Edit Type function.
Adjust asset-level metadata through the Edit Attribute panel.
Execute automation, export data, or customize views using the Automation, Export, and Edit Columns links.
Access detailed asset views through the Summary and Inventory Details tabs.
Explore technical data by reviewing the Software, Vulnerabilities, Controls, and Ports tabs.
You can also see the walkthrough in this link
Top Window

In the top window you can see the following widgets:
Analyzed Assets
Analyzed Assets by Data Source
Analyzed Assets Telemetry
Analyze Assets with Exposures
Summary
.jpg)
In this tab you can see a summary of the asset:
Vulnerability Summary
Risk equation for the asset
Top vulnerability findings for the asset
Top vulnerable software found in the asset
Vulnerabilities
.jpg)
In this tab you can see all the vulnerabilities present in the asset.
Controls
.jpg)
In this tab you can see all the controls applied to the asset.
Software
.jpg)
In this tab you can see all the software installed in the asset.
Inventory
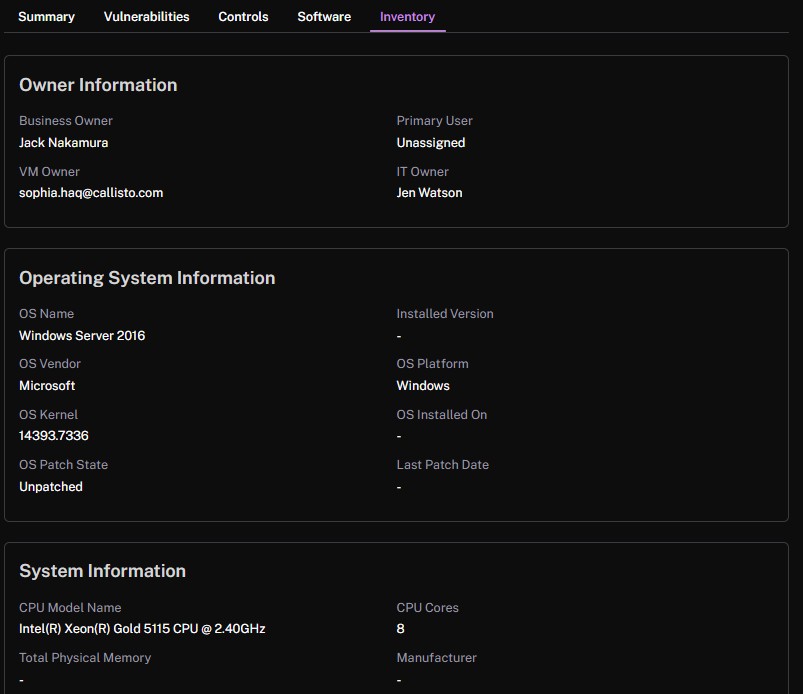
In this tab you can see the main attributes of the asset:
Owner Information
Business owner
VM owner
Application owner
IT owner
Operating System Information
OS name
OS vendor
OS kernel
OS patch state
Installed version
OS platform
Last patch date
System Information
CPU model name
Total physical memory
Model
CPU cores
Manufacturer
BIOS information
SMBIOS version
BIOS release date
BIOS vendor
BIOS version
Serial number
Networking information
IP address
Subnet
Site
MAC Address
OEM/ODM
First Seen
Open Ports
Roles
Tags
Data Sources
See also: