Introduction
SAFE Dashboard provides a holistic view of your organization's cybersecurity posture.
The Dashboard is divided into the below sections to display the assessment result.
- Breach Likelihood Trend and Financial Risk Trend
- Top Risk Scenarios
- Actionable Insights
- Technology Distribution
- Third-party
- People
Breach Likelihood Trend and Financial Risk Trend
Overall breach likelihood trend
By default, SAFE displays the overall breach likelihood percentage timeline frame modeled graph to present the breach likelihood trend for the organization on the main dashboard. The current breach likelihood is available in the dial view for the organization.
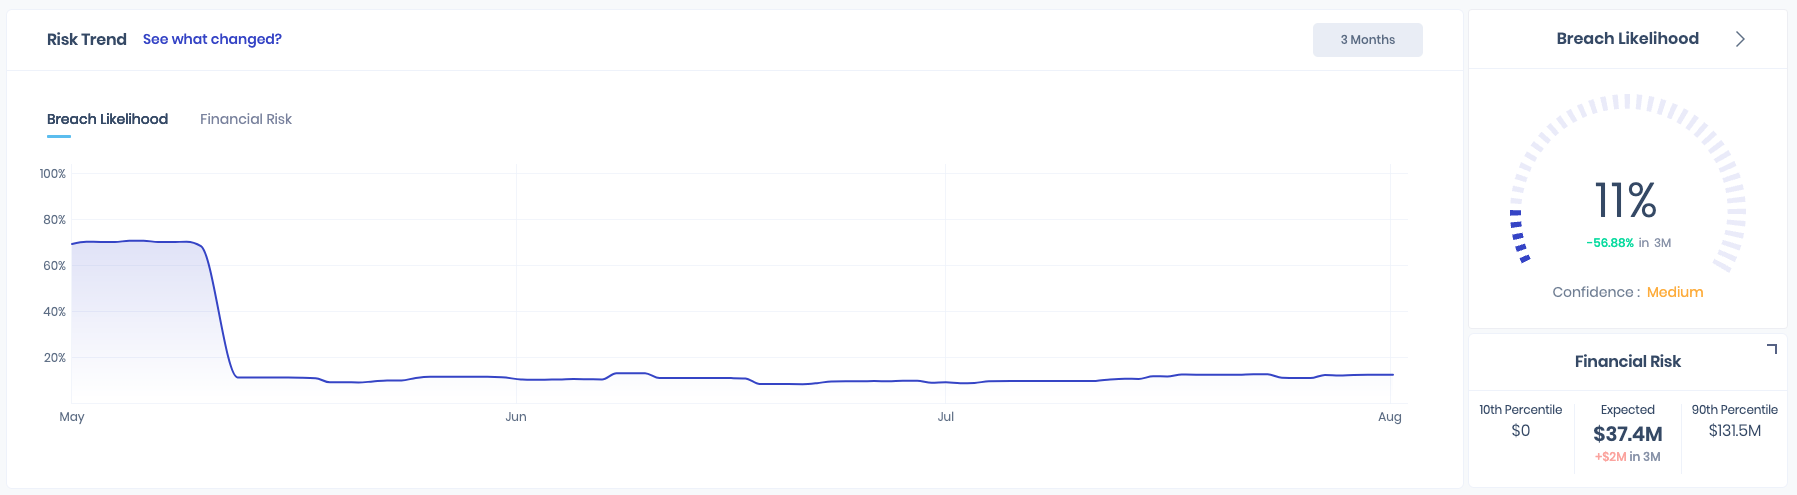
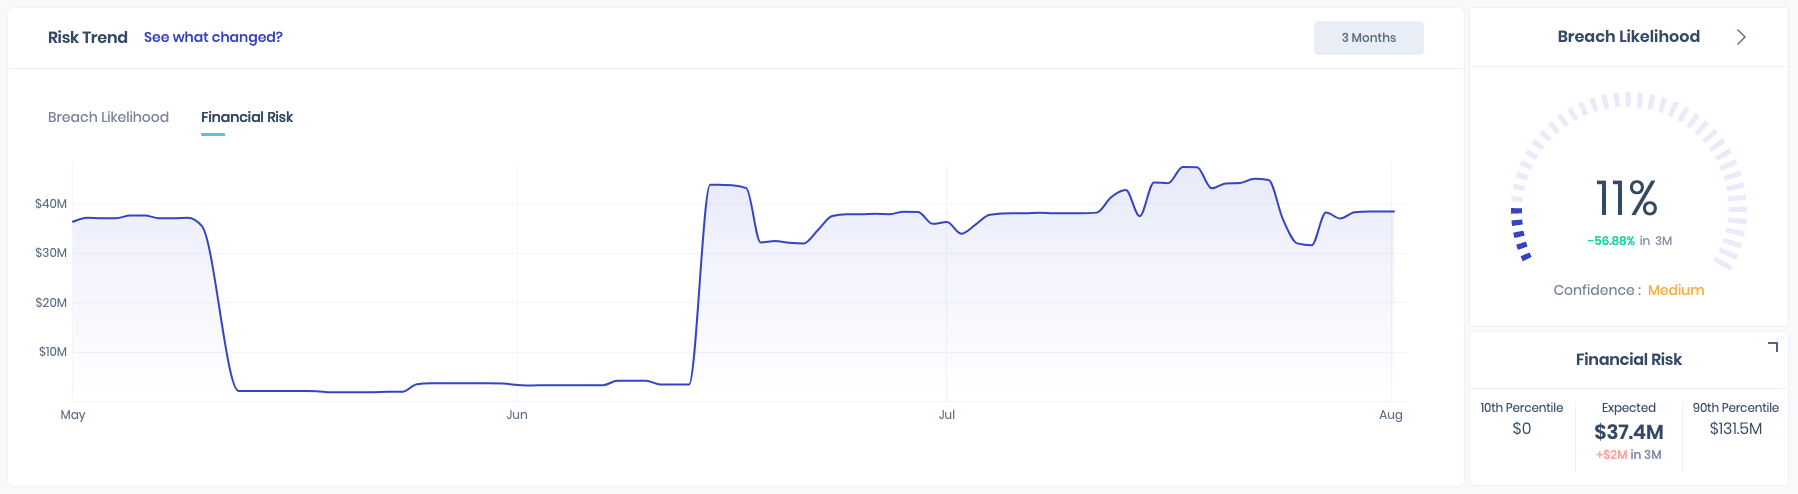
Financial risk trend
Financial risk represents the expected financial loss an enterprise can incur in case of a breach over a 12-month period. It is a function of the SAFE score and estimated financial impact associated with the risk scenario. In addition to the breach likelihood trend, SAFE displays the financial risk trend in a separate tab on the main dashboard.
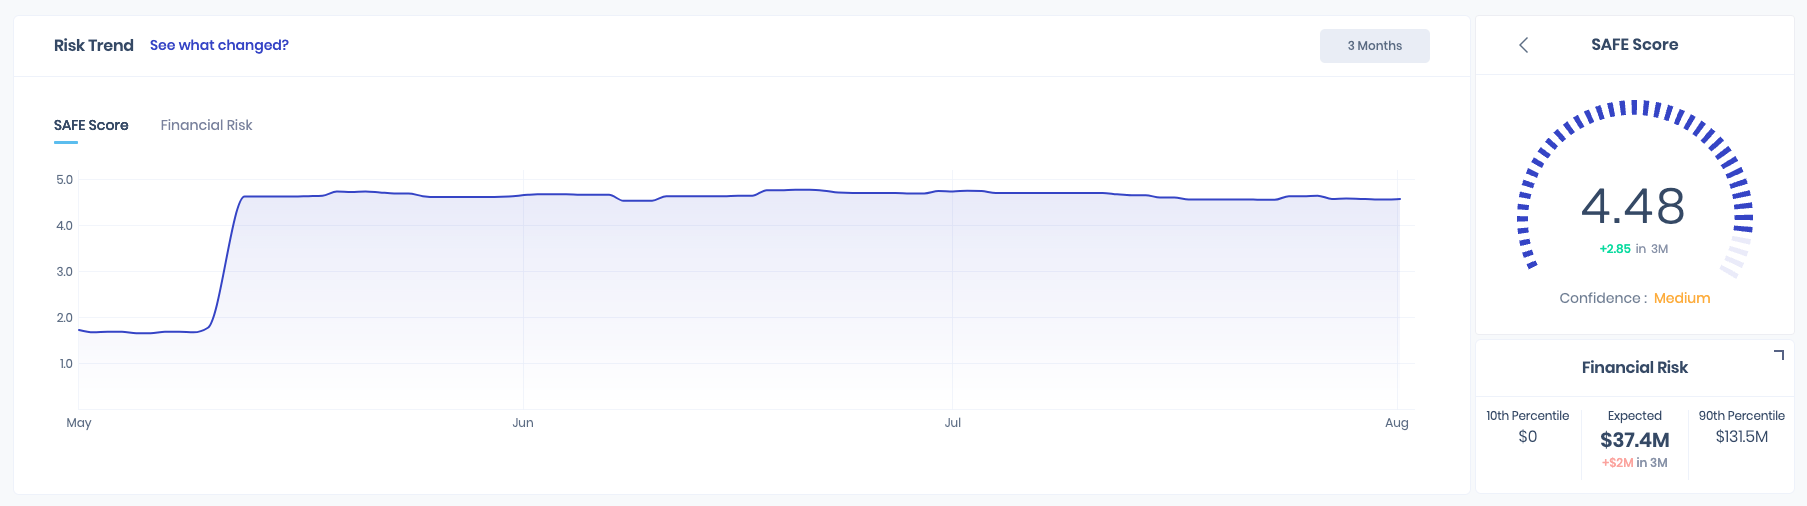
SAEE Score
SAFE scores against cyber risk scenarios are calculated using the SAFE Scoring model, which takes into account the adversarial behaviors (techniques) and objectives (tactics) to estimate the breach likelihood. This information is further enriched with threat intelligence, which indicates for a particular risk scenario how prevalent is the attacker’s behavior.
SAFE references the adversary behaviors and objectives outlined in the MITRE ATT&CK® framework.
Users can see the SAFE Score and score trend for the overall organization by clicking the > icon available next to the Breach Likelihood title in the dial view.
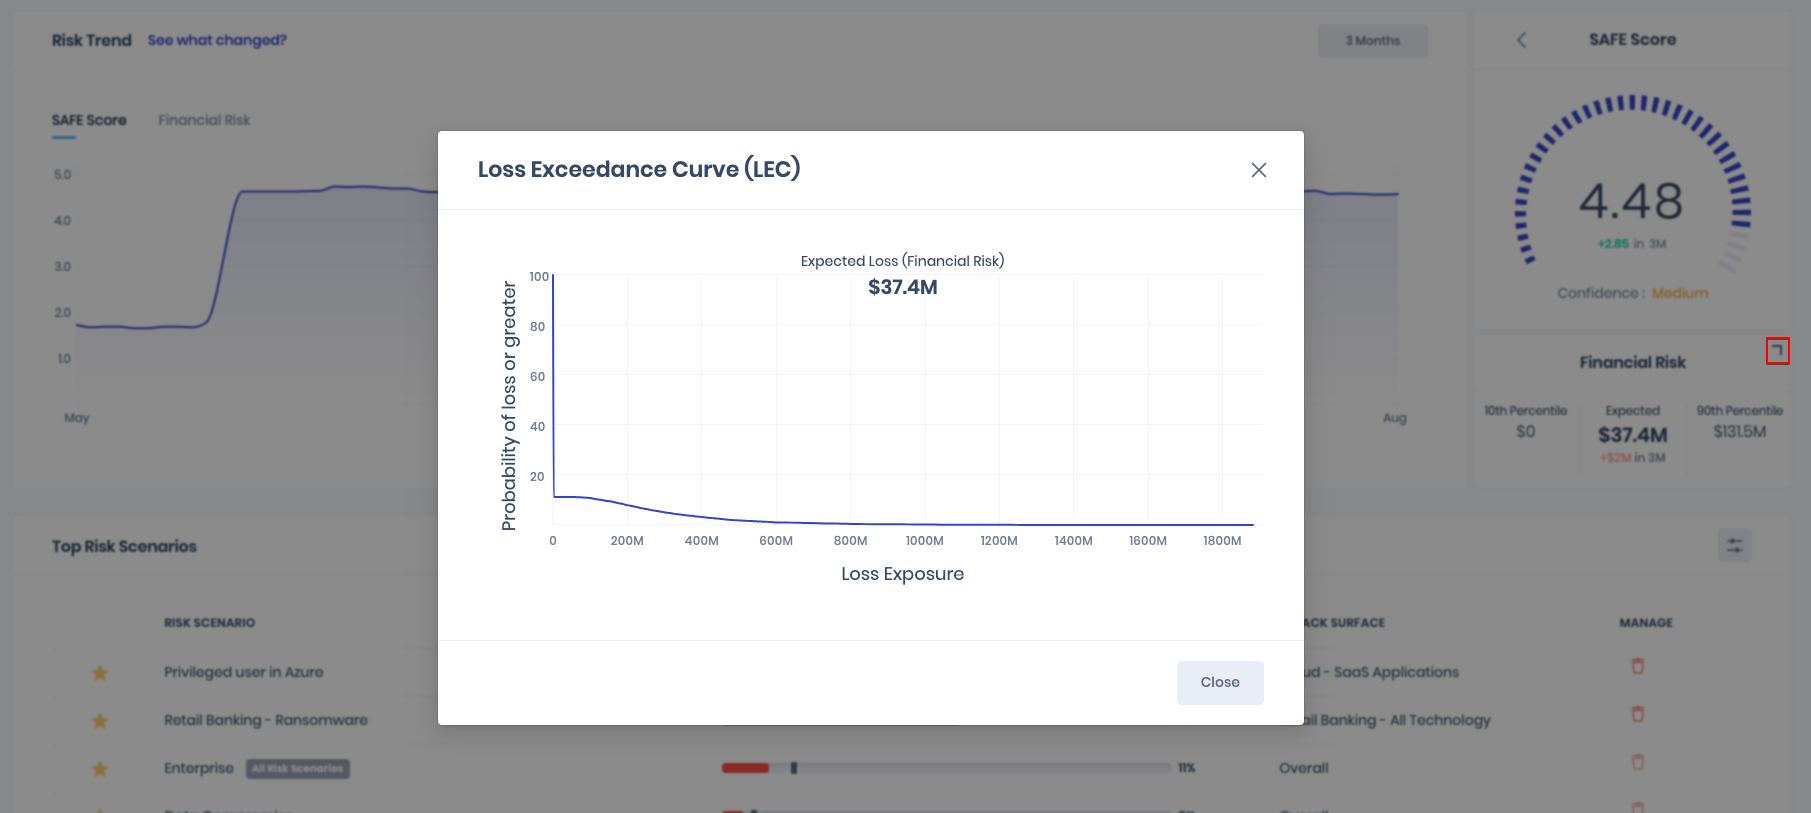
Loss Exceedance Curve (LEC)
SAFE displays the Loss Exceedance Curve (LEC), a graph that displays the Probability of loss on the X-axis and Expected Loss on the Y-axis. To view the Loss Exceedance Curve, click the arrow available on the Financial Risk section on the main dashboard.
Top Risk Scenarios
SAFE continuously monitors top Cyber Risk Scenarios by correlating all the security findings to respective MITRE ATT&CK TTP (Tactics, Techniques & Procedures). Currently, 20 Cyber Risk Scenarios are supported based on recent security trends and historical breach data. Additional Cyber Risk Scenarios will be added as the relevant security trends change over time.
SAFE provides risk quantification for each of the Cyber Risk Scenarios, including SAFE Score, Breach Likelihood in percentage, Attack Behavior, Attack Surface, Estimated Financial Impact EFI), and Financial Risk (FR). Additionally, the Industry Benchmark SAFE Score is available for comparative analysis.
Clicking on any of the risk scenarios systems redirects you to the risk scenario details page.
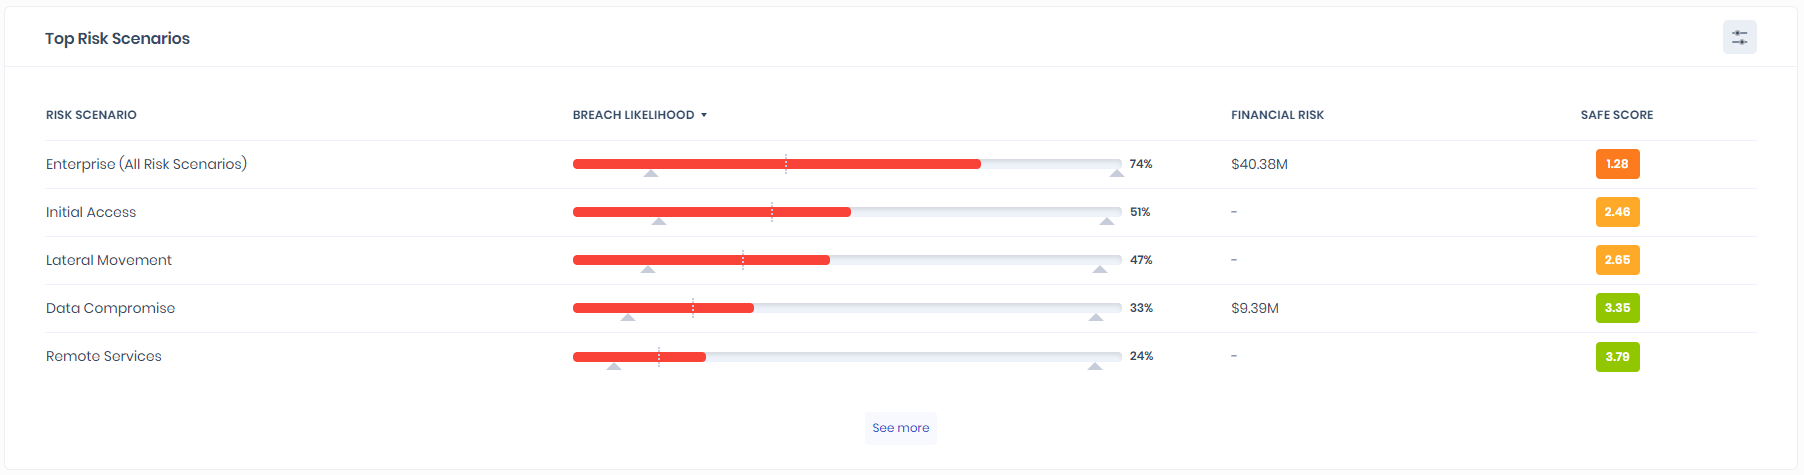
Additionally, we have added details on the industry benchmark of breach likelihood for each cyber risk scenario in SAFE. Hovering on the breach likelihood percentage bar displays the top 10 percentile, average, and bottom 10 percentile in SAFE.
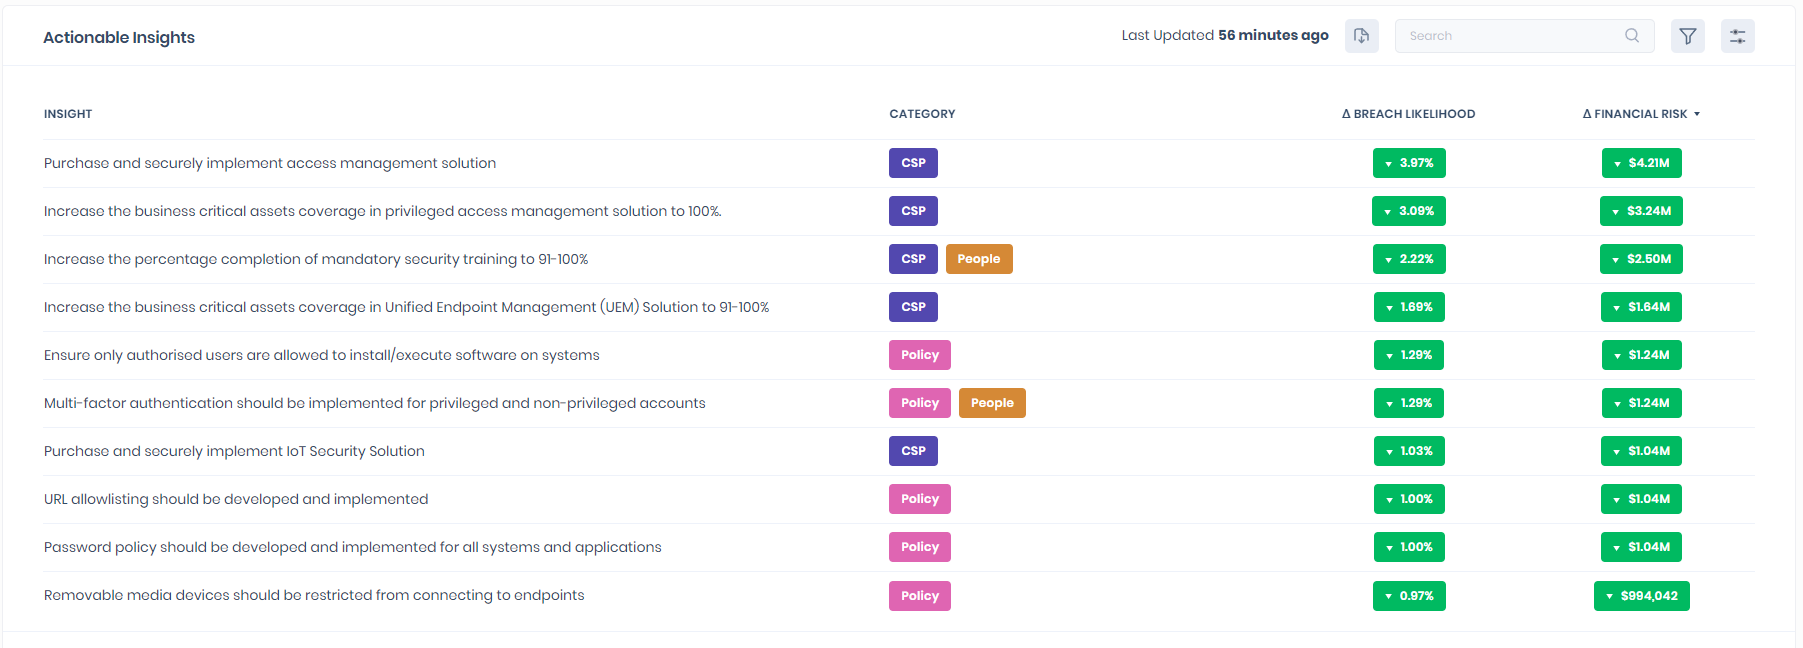
Actionable Insights
SAFE displays all security findings that need immediate attention as Prioritised Actionable Insights. These insights are available on the main dashboard for enterprise cyber risk scenarios and the individual cyber risk scenario dashboard. The prioritized list of actionable insights will help you measure, manage and mitigate the identified security findings.
Technology Distribution
The Technology Distribution dashlet on the SAFE dashboard displays the common attack surface groups on the X-axis and the number of attack surfaces on the Y-axis. It also displays the total number of assets at the top-right corner of this dashlet.
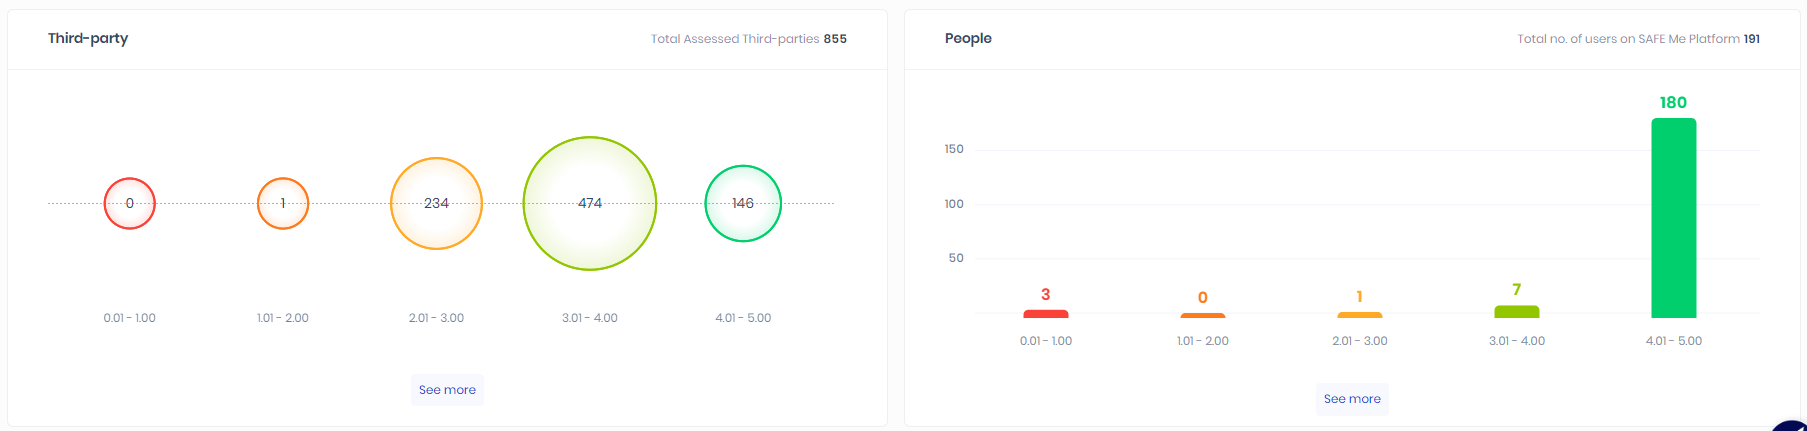
Third-party
This section displays the distribution of all the onboarded Third-parties in the SAFE Score range of 0.01 to 1.00, 1.01 to 2.00, 2.01 to 3.00, 3.01 to 4.00, and 4.01 to 5.00. It also displays the total number of third parties in your organization.
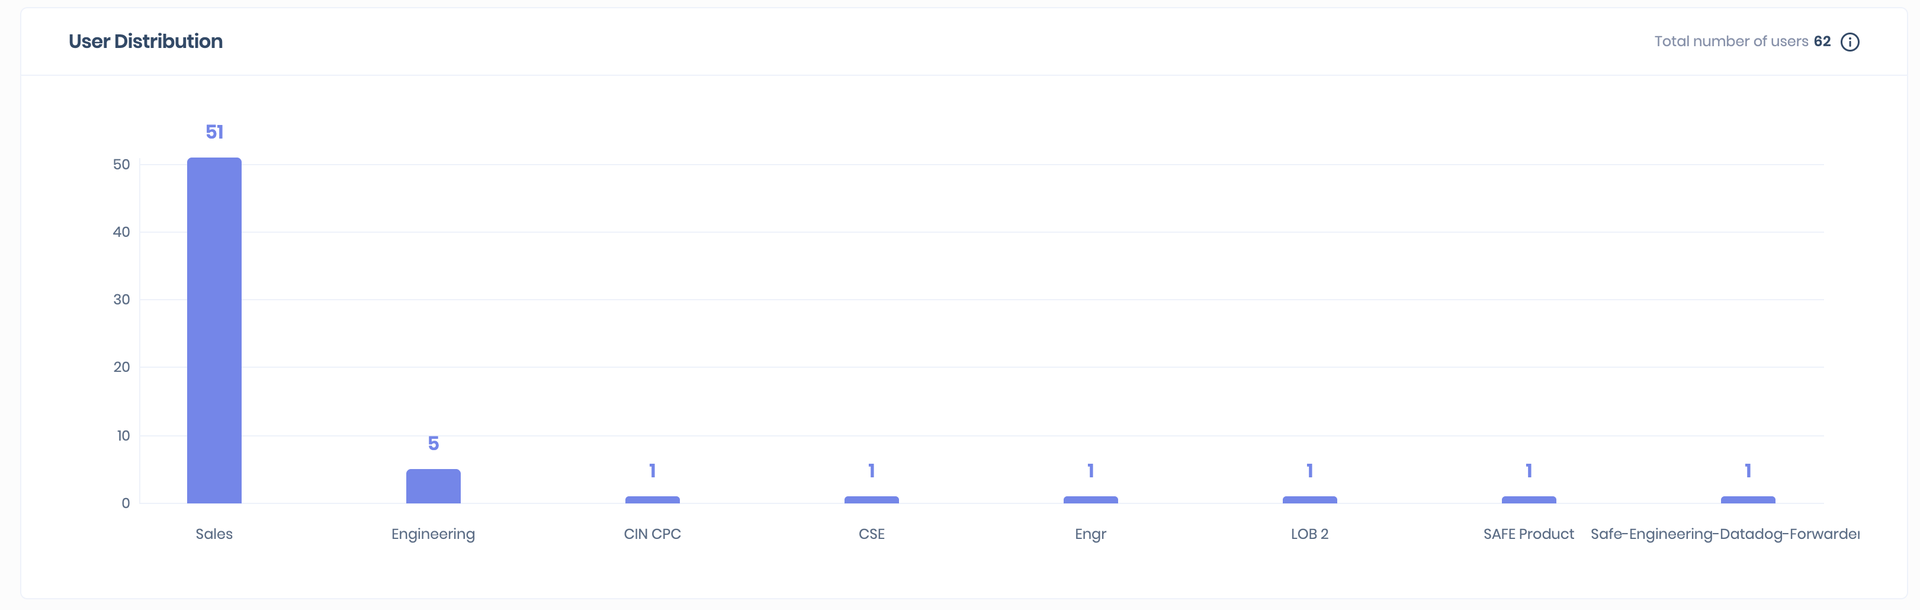
People
This section displays the users' distribution in the SAFE Score range of 0.01 to 1.00, 1.01 to 2.00, 2.01 to 3.00, 3.01 to 4.00, and 4.01 to 5.00. It also displays the total number of SAFE Me users in your organization.