Introduction
SAFE Dashboards provide a comprehensive and real-time view of an organization’s cyber risk posture through interactive widgets and visualizations. These dashboards enable security and risk professionals to monitor, assess, and manage cyber risks effectively, helping organizations make informed decisions. SAFE offers multiple out-of-the-box (OOTB) dashboards tailored to different stakeholders, ensuring that relevant insights are available to executives, security teams, and compliance professionals.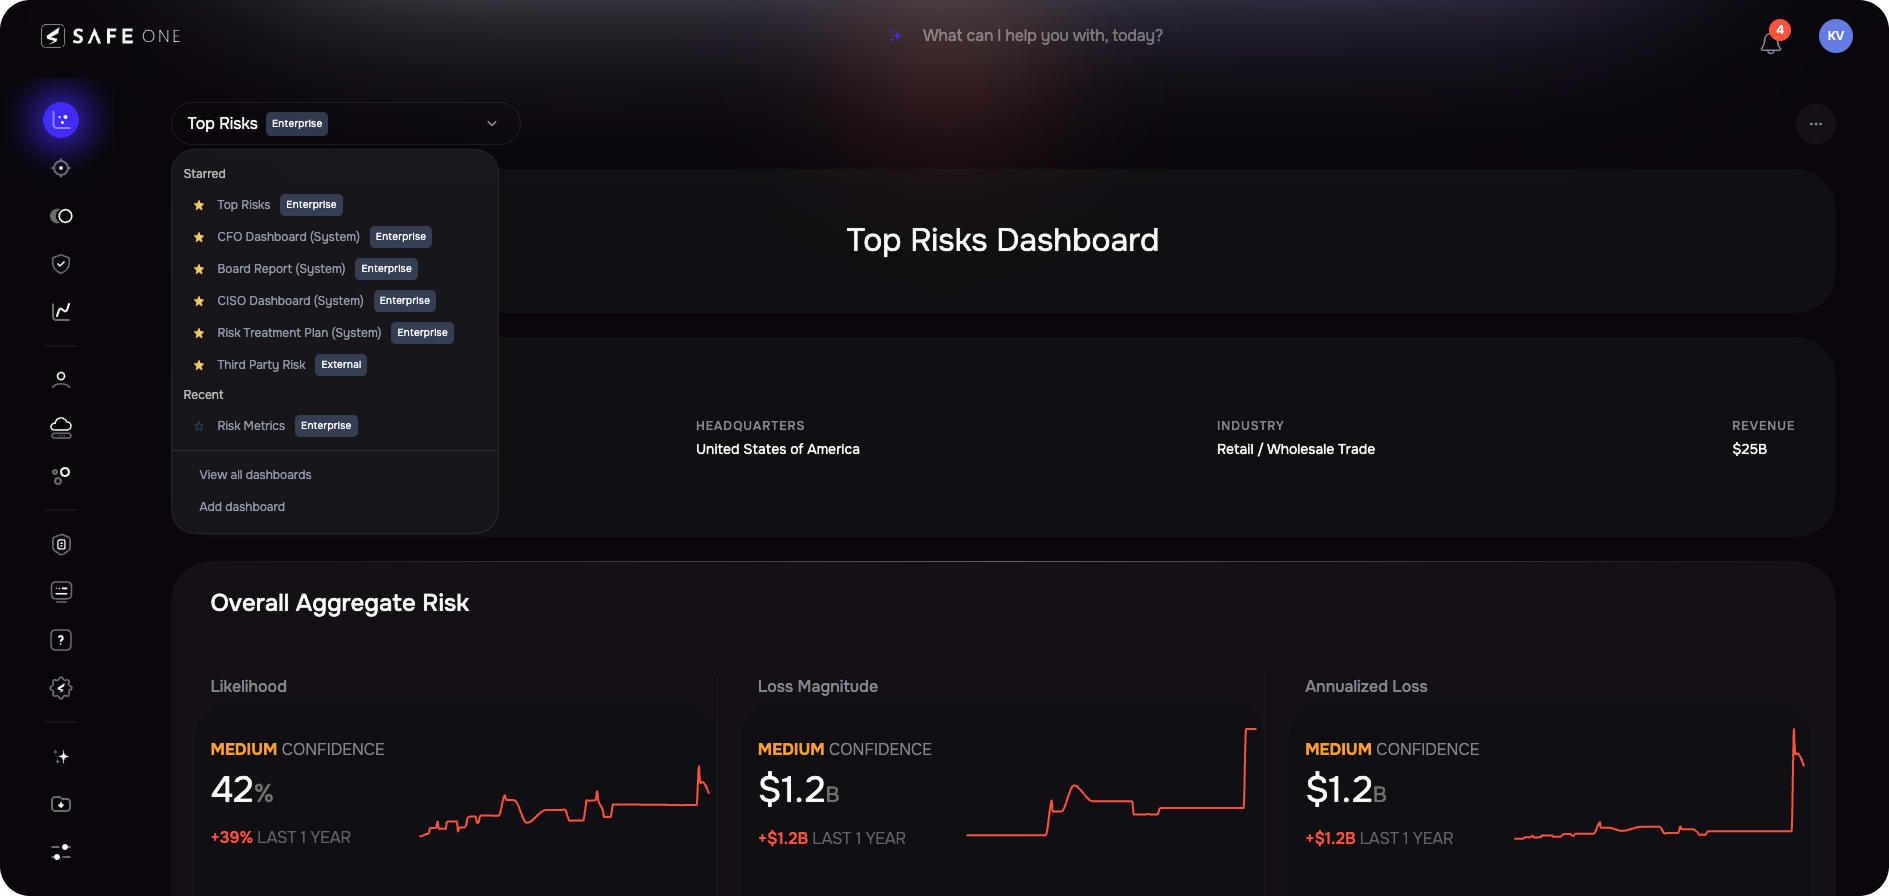
Out-of-the-Box (OOTB) Dashboards
Top Risks Dashboard
The Top Risks Dashboard provides a high-level view of the most critical risks affecting the organization, helping leaders prioritize risk mitigation efforts. It includes:
Company Details – Key organizational risk information, including industry, region, and overall security posture.
Overall Aggregated Risk – A consolidated view of the organization’s risk, analyzing likelihood and loss magnitude to determine potential financial and operational impacts.
Aggregated Risk Trend – Displays historical and real-time trends in risk levels over time.
Riskiest Groups – Identifies the departments or business units with the highest risk exposure.
Riskiest Third-Parties – Highlights third-party vendors that pose the most significant risks based on security assessments and past incidents.
Best Performing Risk Scenarios – Showcases risk scenarios where controls have been most effective, demonstrating successful risk mitigation strategies.
Worst Performing Risk Scenarios – Identifies the most vulnerable risk scenarios, indicating areas requiring immediate attention and improvement.
CISO Dashboard
The CISO Dashboard is designed for Chief Information Security Officers (CISOs), providing in-depth insights into cyber risks, security controls, and compliance status. It includes:
Company Details – Business-specific risk profile and security posture.
Overall Aggregated Risk (Likelihood and Loss Magnitude) – A risk summary based on comprehensive security assessments.
Aggregated Risk Trend – Helps track risk progression and mitigation effectiveness.
Top Control Recommendations – Suggested improvements to security controls based on current vulnerabilities.
Top Finding Recommendations – Key insights into risk-related findings, including suggested remediation actions.
Riskiest Groups – Identifies the internal business units with the most severe risks.
Riskiest Third-Parties – Highlights external vendors contributing to the highest risks.
Riskiest Scenario – The most critical risk scenario that requires immediate action.
Worst Performing Risk Scenario – Areas where security measures have failed to contain risks.
Best Performing Risk Scenario – Risk scenarios where security controls have been most effective.
Integration Insights – Overview of integrated security tools (SIEMs, SAST, SCA, etc.) and their contributions to risk management.
Asset Insights – Analysis of high-risk assets and their security vulnerabilities.
Finding Insights – Overview of security findings, classified by severity and impact.
Control Insights – Evaluation of security controls, their effectiveness, and areas for enhancement.
Board Report Dashboard
The Board Report Dashboard is tailored for board members and executives who require a strategic and business-focused view of cybersecurity risks. It includes:
Overall Aggregated Risk (Likelihood and Loss Magnitude) – A concise summary of enterprise-wide cyber risk exposure.
Top Risky Groups – Identification of business groups with the highest security risks.
Aggregated Risks – An overall risk breakdown that aids in strategic decision-making.
Control Insights – High-level insights into security control effectiveness.
Control Recommendations – Suggested strategic security improvements.
Finding Recommendations – Key remediation actions required to mitigate risks.
CFO Dashboard
The CFO Dashboard focuses on the financial impact of cybersecurity risks, allowing CFOs to align security investments with business priorities. It includes:
Overall Aggregated Risk (Likelihood and Loss Magnitude) – A financial risk assessment of cybersecurity threats.
Contributing Risk Scenarios Summary – Breakdown of aggregated risks in terms of potential financial losses and business impact.
Risk Treatment Plan Dashboard
The Risk Treatment Plan Dashboard provides visibility into risk mitigation strategies and their effectiveness. It includes:
Risk Treatment Plan Summary – A high-level overview of the planned, ongoing, and completed risk mitigation efforts.
Third-Party Risk Dashboard
The Third-Party Risk Dashboard provides continuous monitoring of vendor security risks, helping organizations manage external dependencies effectively. It includes:
Organization Distribution – Categorizes vendors based on their risk exposure and criticality to business operations.
Residual Risk Distribution – Displays remaining risks after mitigation efforts, allowing security teams to identify persistent vulnerabilities.
Security Measures – An overview of security controls implemented to manage third-party risks.
Third-Parties by Losses – Identifies vendors with the highest financial impact due to security breaches or non-compliance.
Third-Parties by Likelihood – Ranks vendors based on the probability of security incidents.
Risk Status – Real-time monitoring of third-party risks, classified by severity.
Geo Distribution – Geographical representation of vendor-related cyber risks, helping organizations assess regional risk factors.
Risk Metric Dashboard
Risk Metrics Dashboard is a centralized view of key risk metrics, enhancing visibility and decision-making.
Aggregate Widgets: Track Risk Likelihood and Loss Magnitude at a glance.
Top 5 Insights Widgets: Identify risks across Top 5 Risky Organizations, Business Units, and Applications.
Control Maturity: Gain insights with aggregate maturity and the number of assessed and automated controls.
Cyber Metric Dashboard
The Cyber Metrics Dashboard is an out-of-the-box dashboard that provides a centralized view of overall risk metrics, attack surface details, and findings. It aggregates key insights such as Overall Aggregated Risk Summary, Asset Distribution, Findings Breakdown, and Targeted Technologies using enterprise group data.