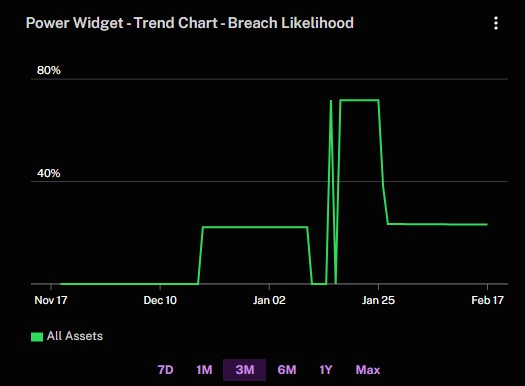
This widget displays how breach likelihood evolves over time, letting you track changes in risk posture and spot patterns or spikes that may require further investigation.
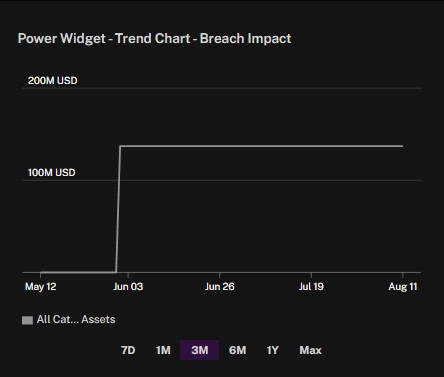
This widget tracks how breach risk (in US dollars) changes over time. It helps you see trends and shifts in potential financial exposure, making it easier to gauge the impact of security improvements or emerging threats.
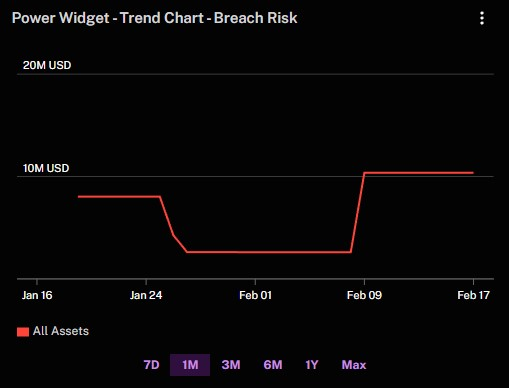
This widget tracks how breach risk (in US dollars) changes over time. It helps you see trends and shifts in potential financial exposure, making it easier to gauge the impact of security improvements or emerging threats.
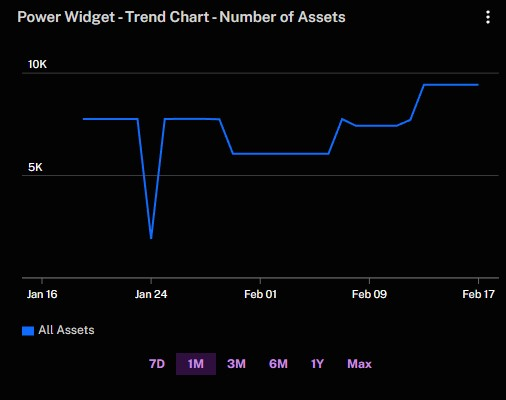
This widget shows how the total count of assets changes over time, helping you track growth or shrinkage in your environment and identify any unusual fluctuations.
.jpg)
This widget shows how your exposure score changes over time, measuring the level of vulnerability across your environment. Tracking this score helps you identify whether your security posture is improving or deteriorating, and whether remediation efforts are effectively reducing overall exposure.
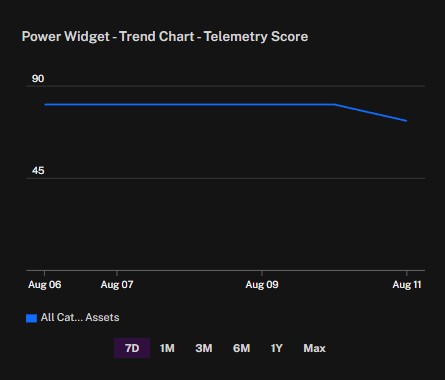
This widget tracks how your telemetry score changes over time, measuring the completeness and quality of security data collected across your assets. Monitoring this score helps ensure you have the visibility needed to detect and respond to threats, and can highlight areas where additional coverage may be required.
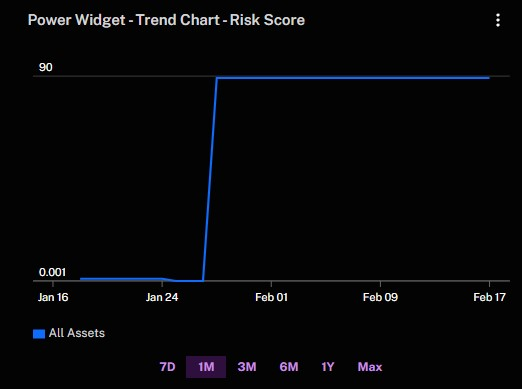
This widget shows how the overall risk score changes over time, letting you monitor improvements or deteriorations in your security posture and assess the impact of any new measures or emerging threats.
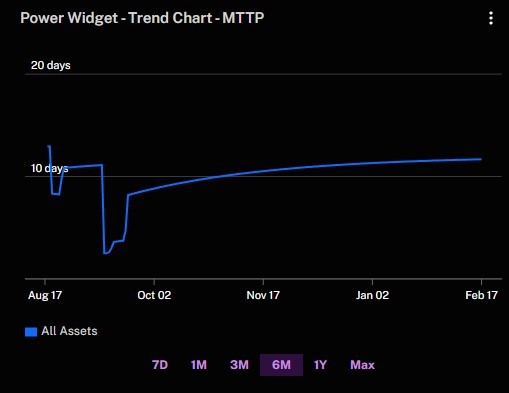
This widget displays how your mean time to patch (MTTP) changes over time, measuring the average duration between the discovery of a vulnerability and the application of a patch. Monitoring MTTP helps you understand how effectively and efficiently your organization responds to newly identified security issues. If this metric is high, it may indicate bottlenecks in your patching process or insufficient resources. By tracking MTTP over days, weeks, or months, you can evaluate the impact of process improvements or new policies, ensuring that vulnerabilities are addressed more quickly and that your organization’s overall security posture remains strong.
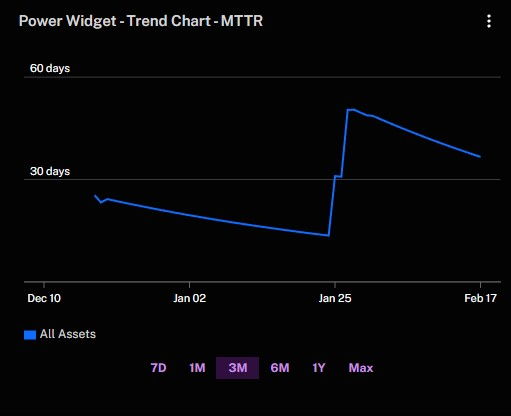
This widget tracks how your mean time to remediate (MTTR) changes over time, measuring the average duration between identifying a security issue and fully resolving it. While MTTP focuses on how quickly you deploy a patch after discovering a vulnerability, MTTR covers the entire remediation process, from detection to final closure. Monitoring MTTR helps you understand where delays may occur—such as in testing or validation—and whether your organization is effectively closing out vulnerabilities. By comparing MTTP and MTTR, you gain insight into both the speed of your patching process and the efficiency of your overall remediation workflow. MTTP only tracks the patching process, while MTTR tracks the full process of addressing a security vulnerability—whether through patching or other mitigation techniques. If no patch is available, MTTP is irrelevant, but MTTR is still important. So, while a fast MTTP indicates an efficient patching process, a fast MTTR signals strong overall security posture and incident response.
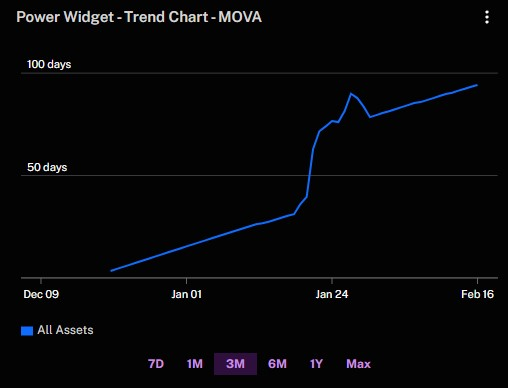
This widget displays how your mean open vulnerability age (MOVA) changes over time, measuring the average number of days that vulnerabilities remain unaddressed. If MOVA is trending upward, it may indicate that your team is taking longer to remediate newly discovered issues or that resources are stretched thin. Conversely, a downward trend suggests improvements in closing out vulnerabilities more quickly. Monitoring this metric helps you ensure that potential risks don’t linger in your environment, ultimately supporting a more proactive and efficient vulnerability management process.
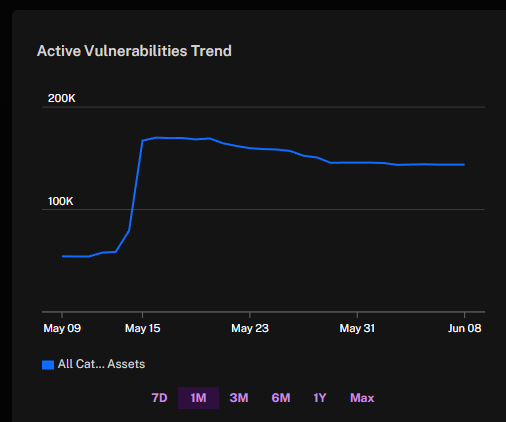
This widget displays the active number of vulnerabilities over time.
See Also: