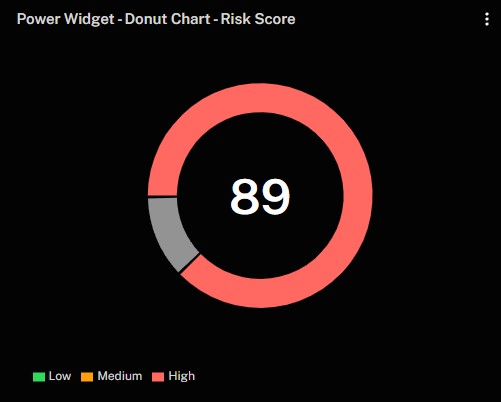
This widget displays an overall risk score in a color-coded donut chart, giving you a quick, at-a-glance assessment of your security posture. The center of the donut shows the numerical risk value, and the surrounding segments reflect the severity level—such as Low, Medium, or High—so you can immediately see how serious the threat may be.
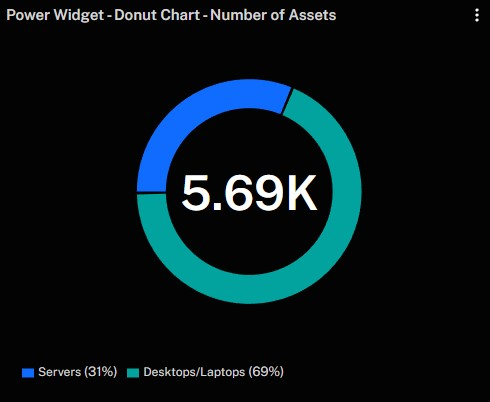
This widget provides a quick overview of how many assets are in your environment, broken down by categories. The total asset count appears in the center, while the donut segments are color-coded to represent each category (e.g., servers, desktops/laptops). This visual breakdown helps you quickly understand the composition of your environment and focus your security measures accordingly.
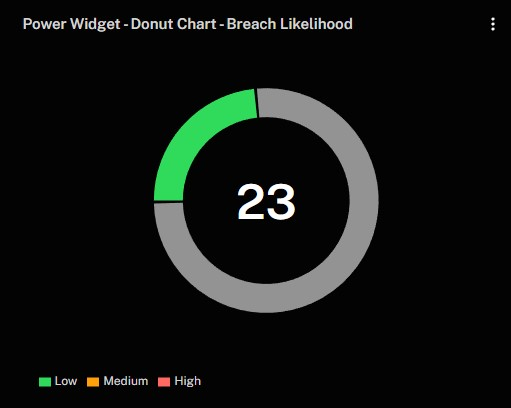
This widget provides a visual representation of your environment’s likelihood of a breach. A numeric value in the center indicates the overall percentage or score, while the donut segments are color-coded (e.g., Low, Medium, High) to show where you stand on the risk spectrum. This layout allows you to see at a glance how urgent your breach risk may be and to prioritize security efforts accordingly.
See Also: