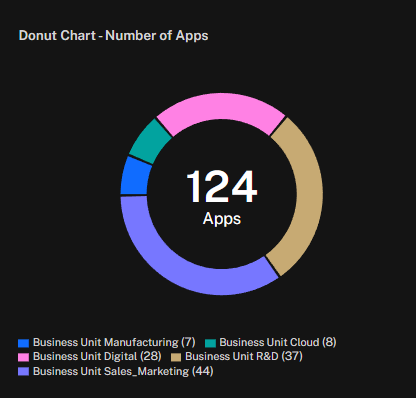
The Donut Chart widget displays the total number of applications in the environment and their distribution across business units. The center of the chart shows the overall application count, while each colored segment represents a business unit’s share.
This widget helps teams understand how applications are distributed across the organization, identify which business units manage the largest or smallest portions, and support planning or risk analysis based on application ownership.
You can also configure the widget to display exposure score.
See Also: