Introduction
The Risk Summary page provides a consolidated view of a third-party’s risk posture, allowing you to view SAFE Score, Loss Magnitude, findings, controls, and other key risk metrics.
Overview of Risk Summary
The Risk Summary page displays:
SAFE Score and its trend
Loss Magnitude and its trend
Findings (Outside-in and Questionnaier)
Controls
You can change the trend timeframe by clicking the time selector and choosing from the preconfigured timeframes:
1 Year (Default)
3 Months
1 Month
1 Week
When you hover over the SAFE Score trend graph, the system displays the exact SAFE Score at that particular point in time.
.png)
View Risk Summary Details
Clicking the SAFE Score or Loss Magnitude card will redirect you to the Aggregated Risk page for that third-party.
On the Aggregated Risk page, you can view:
SAFE Score
Loss Magnitude
Annualized Loss
Outside-In Findings
Questionnaire Findings
.png)
Viewing Controls
You can switch the view from Findings to Controls to see:
The specific controls impacting the SAFE Score
Recommendations to improve the SAFE Score
.png)
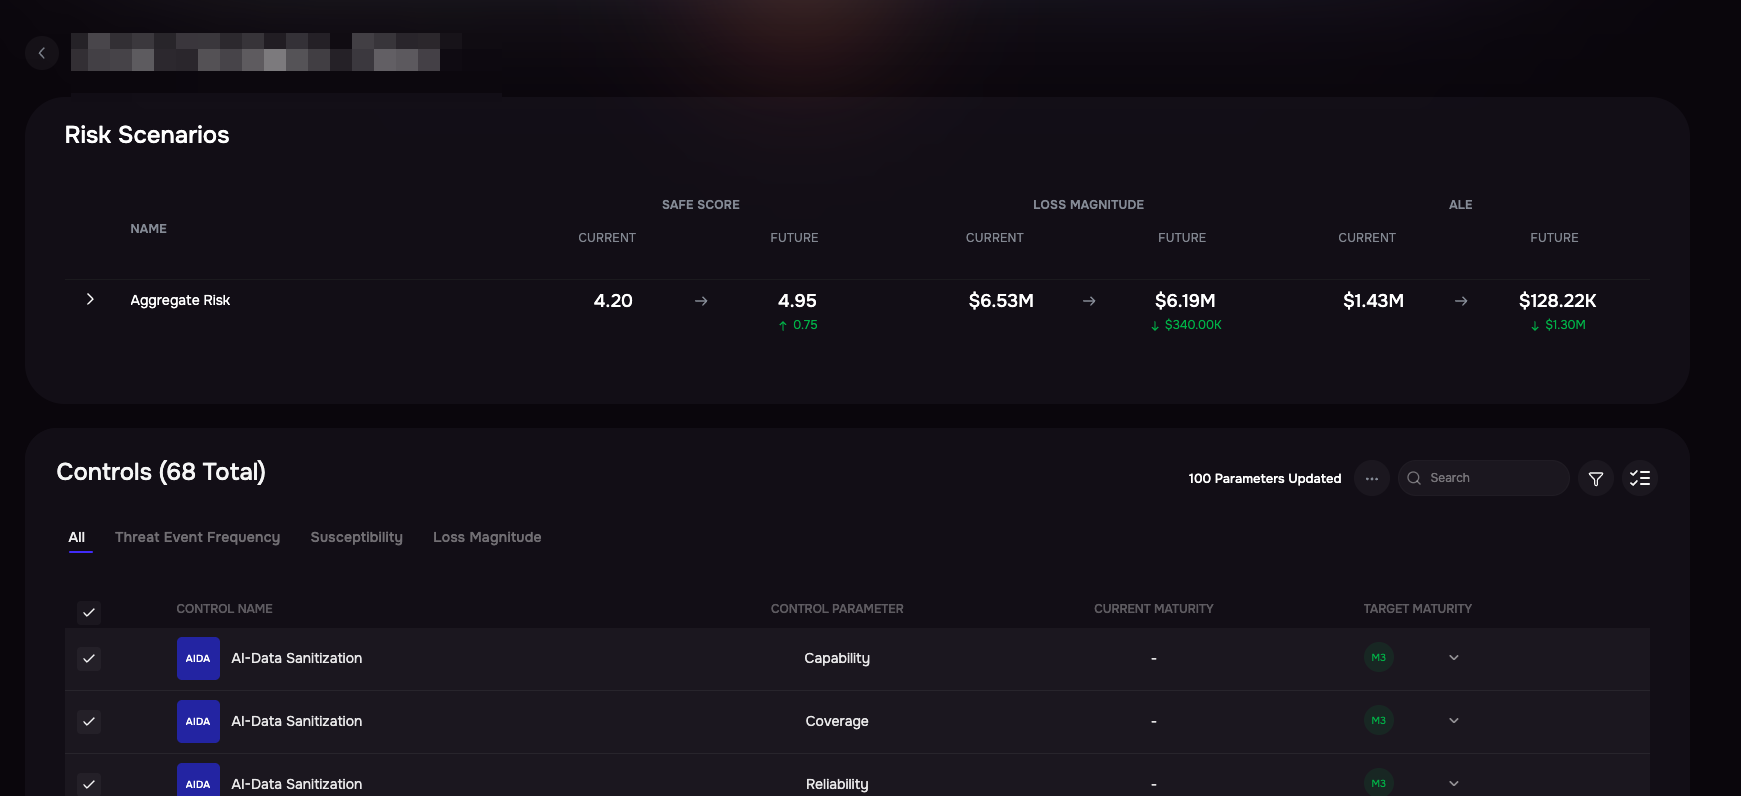
What-If Analysis
The system allows you to perform a What-If Analysis to simulate the impact of changes in controls on the SAFE Score, Loss Magnitude, and ALE.
To perform a What-If Analysis:
Click the What If Analysis button.
Select the target maturity for the controls.
Review the simulated SAFE Score and related metrics.
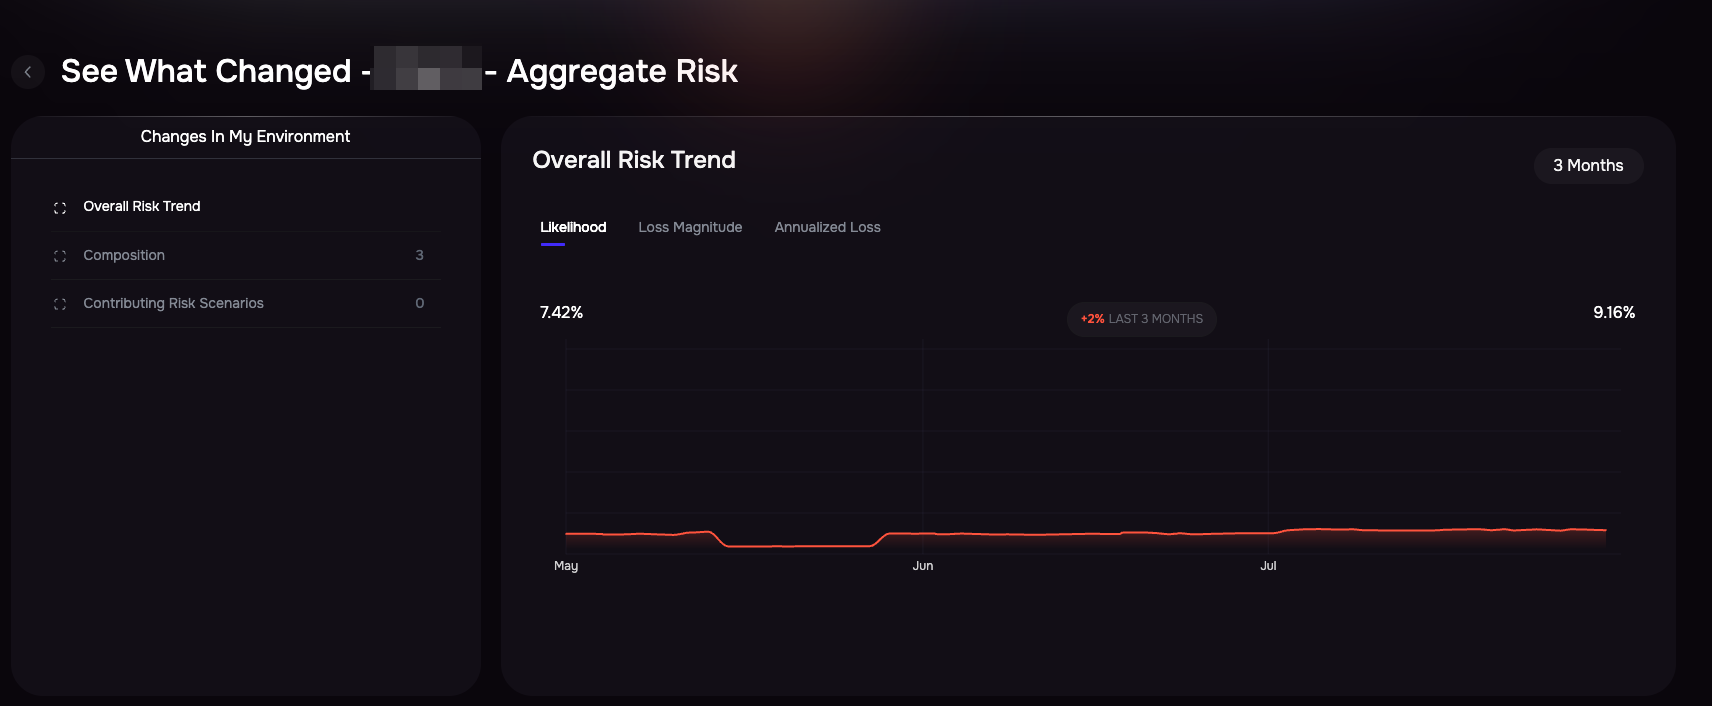
See What Changed
The See What Changed feature helps you track and understand how risk has evolved over time. It provides a clear view of key changes in your environment, iincluding Overall Risk Trend, and Composition.
Click the three-dot menu in the top-right corner of the page.
Select See What Changed from the dropdown options.