Overview
See What’s Changed (SWC) for Aggregate Risk is an explainability capability within SAFE that helps organizations understand how and why risk metrics change over time.
It provides a time-aware analytical layer that correlates shifts in Likelihood, Loss, and Annualized Loss Expectancy (ALE) with the underlying drivers such as asset exposure, findings, control maturity, threat activity, and model changes.
By combining visual trend analysis, drill-down investigation, and AI-generated summaries, SWC enables stakeholders to quickly understand risk movement and confidently explain it to leadership, auditors, and regulators.
Key capabilities include:
Time-filtered risk analysis across multiple timeframes
Visual trend lines highlighting meaningful risk movements
Root cause analysis for risk metric changes
AI-generated summaries explaining drivers in plain language
Drill-down investigation into the exact changes and contributors

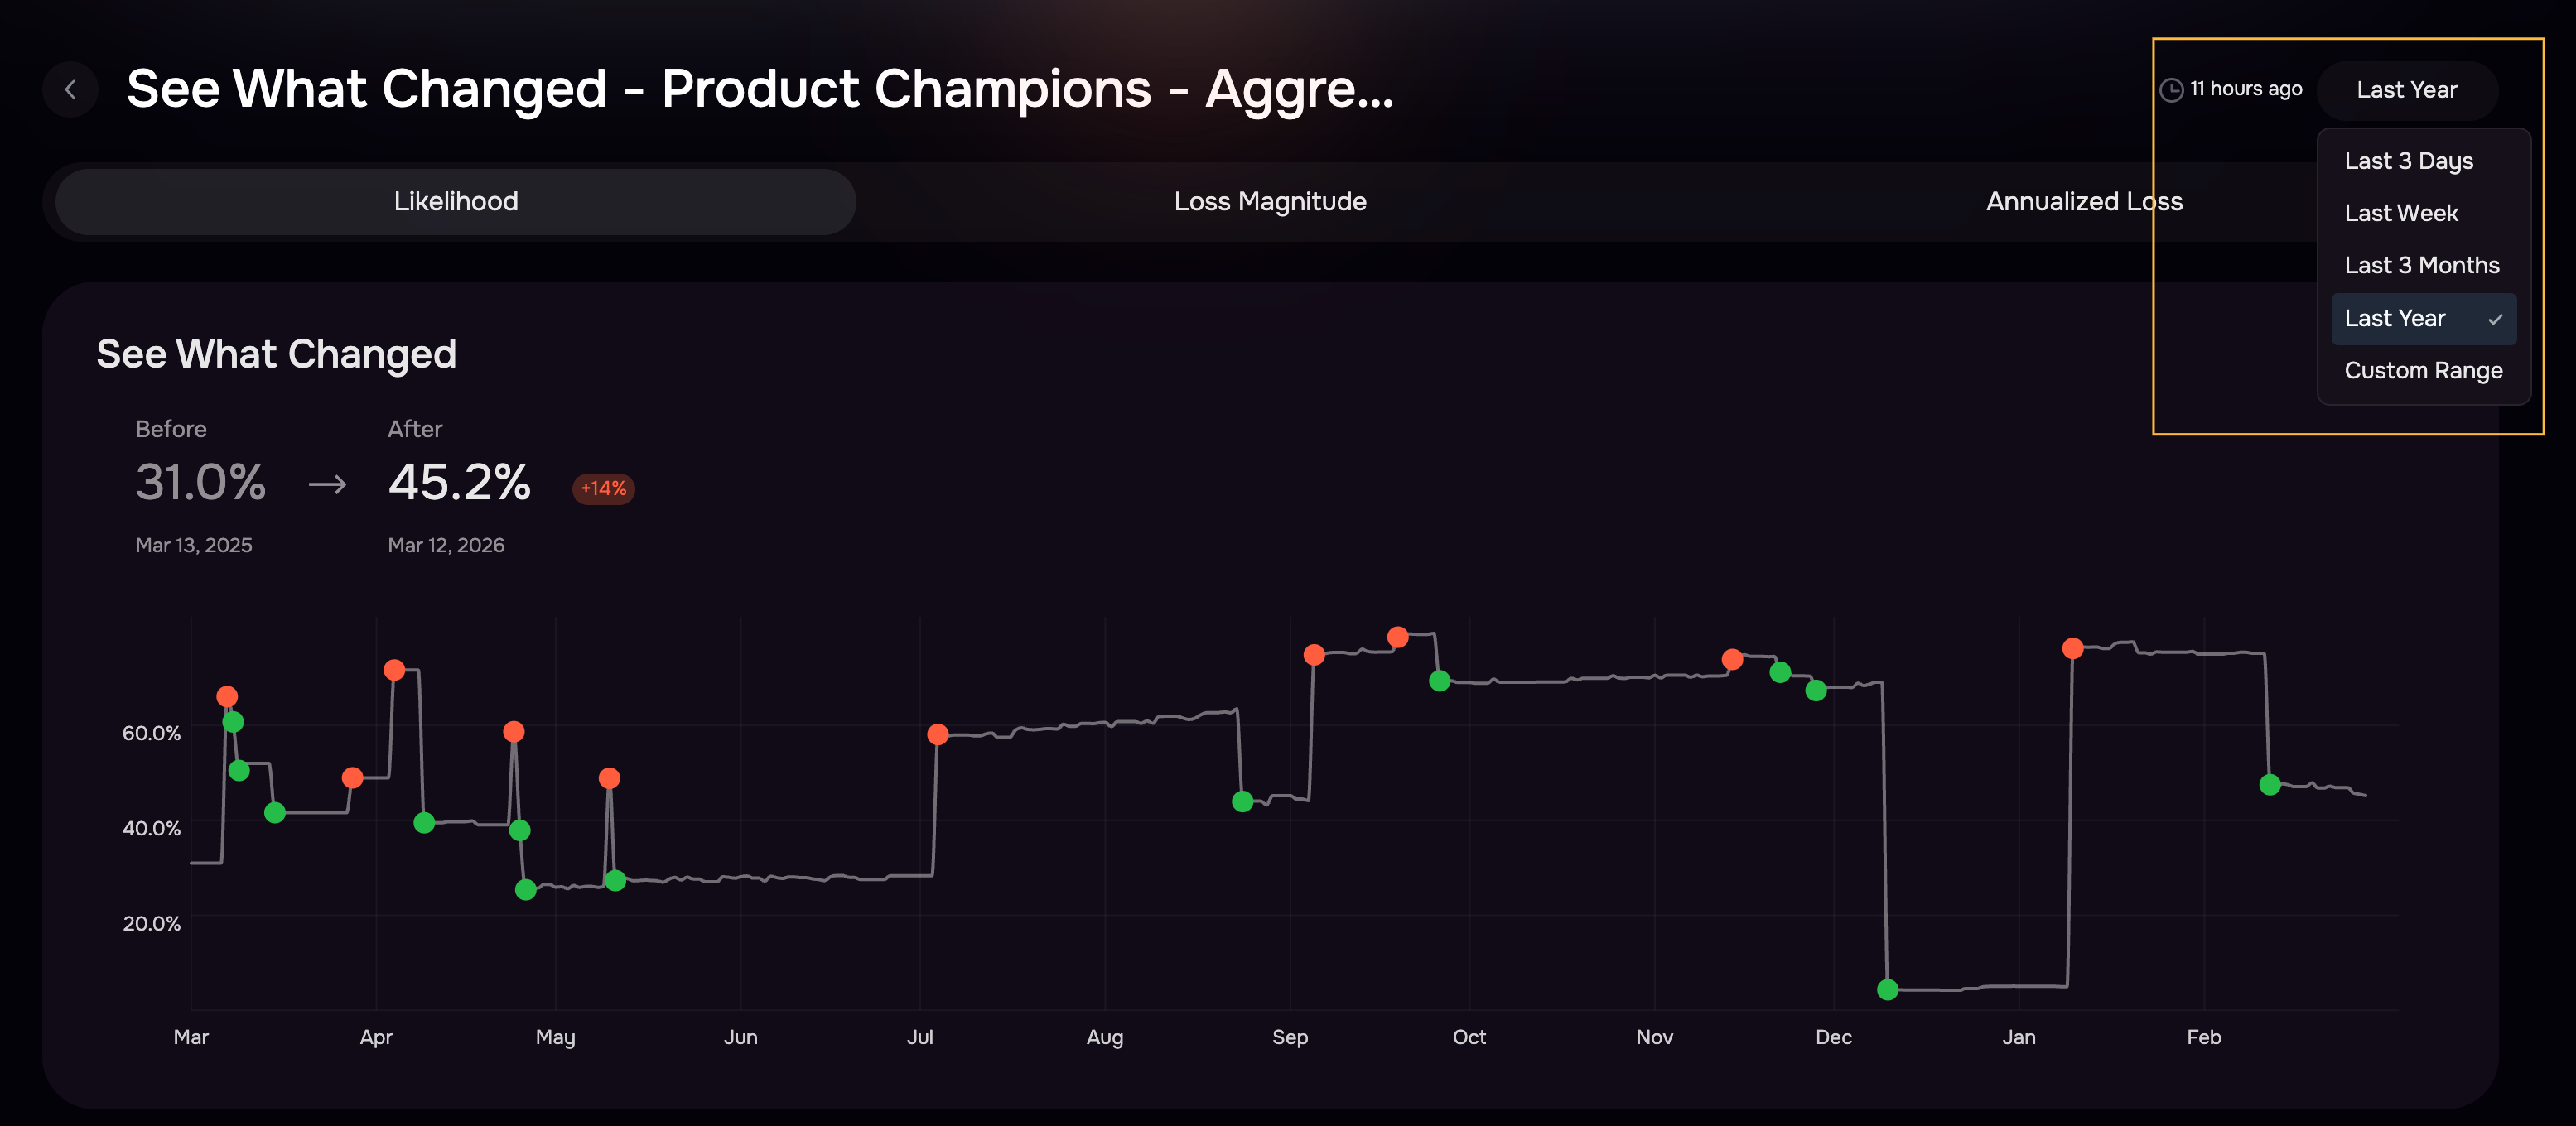
Timeframe Filtering
Users can filter the entire SWC view based on a selected timeframe to analyze risk changes.
Supported time ranges:
Last Day
1 Week
1 Month (Default)
Last 3 Months
Last Year
Custom Date Range
Note: Timeline Detail Variability in See What Changed (SWC)
The level of detail displayed in the See What Changed (SWC) view may vary depending on the selected timeline range.
For example:
In the Last Week timeline view, users can see a more detailed breakdown of contributing factors, including:
High-impact findings
Affected assets
Controls
Composition
Scenarios
Threat events
In longer timeline views such as Last 3 Months, the system currently displays a more summarized set of drivers, including:
Composition
Scenarios
Risk Metric Toggle
Users can switch between different risk metrics to analyze specific dimensions of risk movement.
Available views:
Likelihood Changes
Loss Changes
Annualized Loss Expectancy (ALE) Changes
Each view dynamically updates the trend visualization and the driver breakdown.
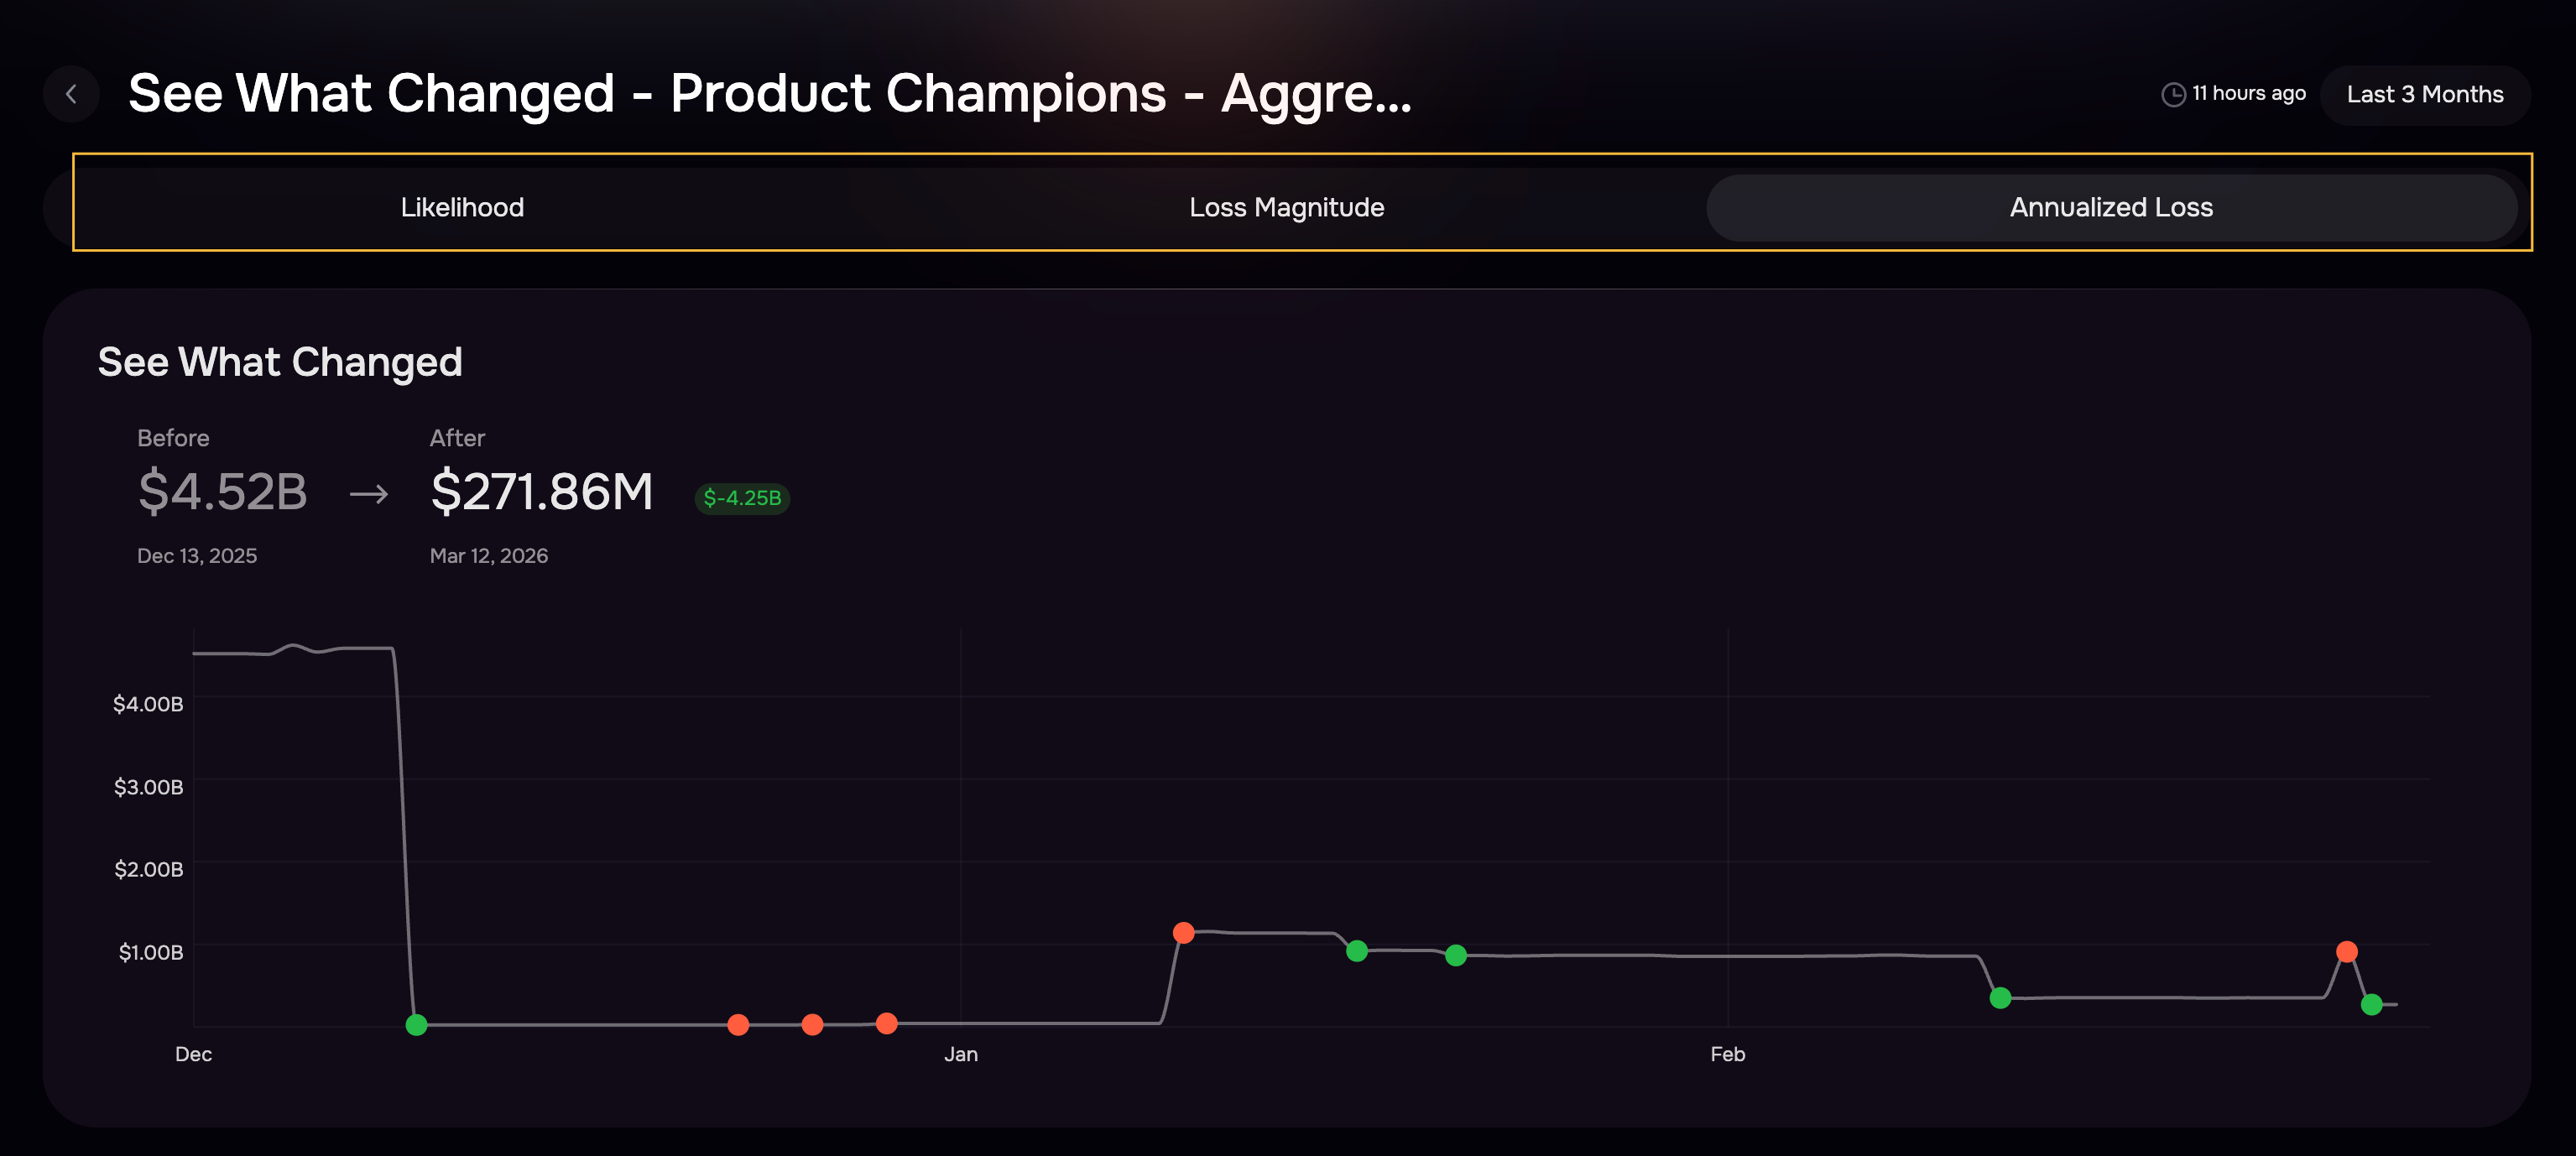
Risk Trend Visualization
SWC includes an interactive trendline component that shows risk movement over time.
Events are plotted per day.
A marker (dot) appears automatically when a ±5% absolute delta from the previous day is detected.
Hovering over the marker shows the risk increase or decrease between dates.
Clicking a marker filters the analysis to that specific change window (the previous day vs. the selected day).
This allows analysts to quickly focus on significant changes rather than manually scanning all the data.
AI-generated Risk Summary
SWC includes an AI-generated summary that explains key drivers behind risk changes.
Written very concisely in plain business language.
The summary is designed to support executive briefings and stakeholder reporting.
Highlights both internal posture changes (controls, scope, assets) and external factors (threat activity).

Likelihood Metrics
Likelihood analysis identifies the drivers that affect the probability of a cyber event.
Assets: Tracks changes in assets contributing to the selected Risk Scenarios. Metrics include:
Assets added or removed
Asset exposure changes
Findings: Tracks changes in findings, including:
High-Impact Findings (HIF)
Other findings
This highlights how vulnerability exposure changed across the selected timeframe.
Controls: Control changes are categorized into:
Maturity Changes: Changes in maturity scores for controls that existed in both the previous and current state.
Scope Changes: Controls that were:
Added
Removed
Newly mapped to scenarios
Risk Scenario Composition: Tracks changes to the aggregate risk definition:
Scenarios added
Scenarios removed
Changes impacting scenario likelihood
Threat Events
Shows threat activity related to the Threat Actor (TA) and Initial Access Method (IAM) combinations defined in the aggregate risk.
This highlights changes in external threats impacting the likelihood.
Group Metadata
Captures structural updates affecting risk calculations, such as:
Risk group metadata updates
Classification or mapping changes

Loss Metrics
Loss metrics explain drivers affecting the financial impact of cyber events.
Impact Controls
Controls designed to reduce financial impact (recovery, containment, response).
Changes include Maturity updates and Scope adjustments
Loss Drivers
Changes to drivers used in loss calculations for the aggregate risk.
Financial Impact Questions
Changes to the responses or structure of financial impact inputs used in CRQ modeling.
Composition and Scenarios
Changes in scenario definitions that influence loss outcomes.
Group Metadata
Updates to metadata or structural parameters impacting loss calculations.
ALE Metrics
Annualized Loss Expectancy (ALE) represents the combined effect of Likelihood and Loss.
ALE analysis highlights changes in:
Likelihood drivers
Loss drivers
Scenario composition
This provides a single view of total risk movement.