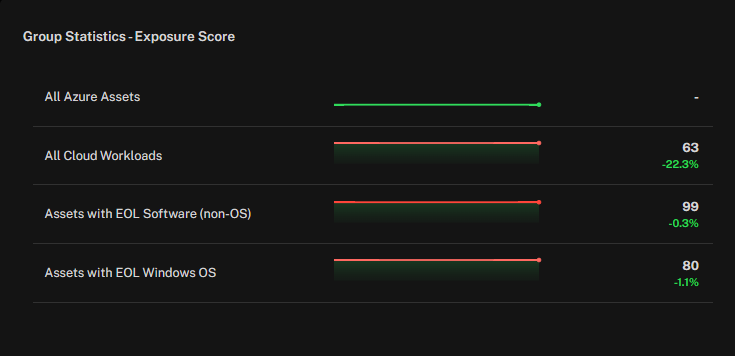
The Group Statistics – Exposure Score widget compares exposure across different asset groups, making it easy to identify which categories contribute most to overall risk and how those risks are trending over time.
Groups may include predefined or custom categories such as All Azure Assets, Cloud Workloads, or Assets with End-of-Life (EOL) Software.
Exposure Score provides a normalized measure of relative risk for each group. Higher scores indicate greater exposure.
Trend Percentage shows how the score has changed since the previous measurement:
Negative values indicate improvement.
Positive values reflect increased exposure.
Visual Bars use red and green gradients to represent the relative position of each group’s score on the risk spectrum.
This widget helps teams track where exposure is concentrated, validate the impact of remediation efforts, and prioritize which asset groups require attention to reduce risk.
Group Statistics – MTTR
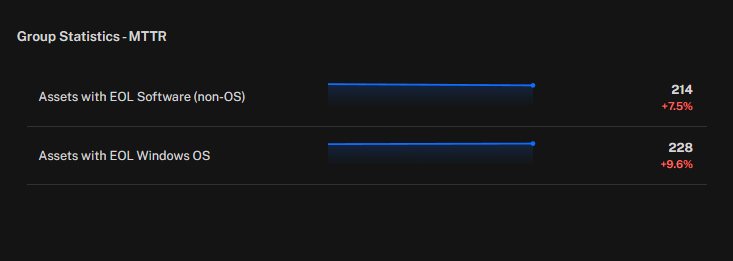
The Group Statistics – MTTR widget tracks the average Mean Time to Remediate (MTTR) for specific asset groups, providing insight into how quickly vulnerabilities or risks are being addressed.
Groups represent targeted categories such as Assets with End-of-Life (EOL) Software (non-OS) or Assets with EOL Windows OS.
MTTR Value shows the current average remediation time for that group (for example, 214 or 228).
Trend Percentage indicates how the MTTR has changed relative to the previous measurement:
Positive red values (for example, +9.6%) mean remediation times are getting worse.
Negative values would indicate improvement.
Visual Indicators include horizontal blue bars that place each group’s MTTR on a relative scale for quick comparison.
By surfacing both the raw MTTR values and their trends, this widget helps teams measure operational efficiency, detect delays in addressing critical risks, and prioritize groups where remediation is lagging.
See Also: