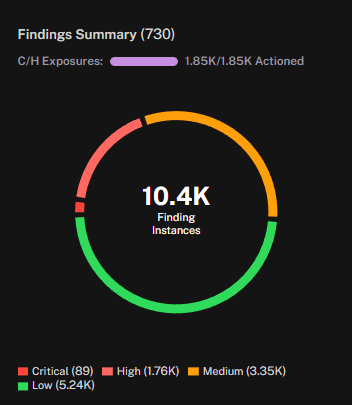
The Findings Summary widget provides a high-level visualization of all vulnerability findings, segmented by severity.
Center Value displays the total number of finding instances.
Donut Segments are color-coded by severity level: Critical, High, Medium, and Low.
Legend lists the count of findings in each severity category.
Header Metric tracks the status of critical and high exposures, showing how many have been actioned.
This widget enables teams to quickly assess the overall vulnerability landscape, understand the distribution of findings by severity, and verify progress on addressing the most critical exposures.
See Also: