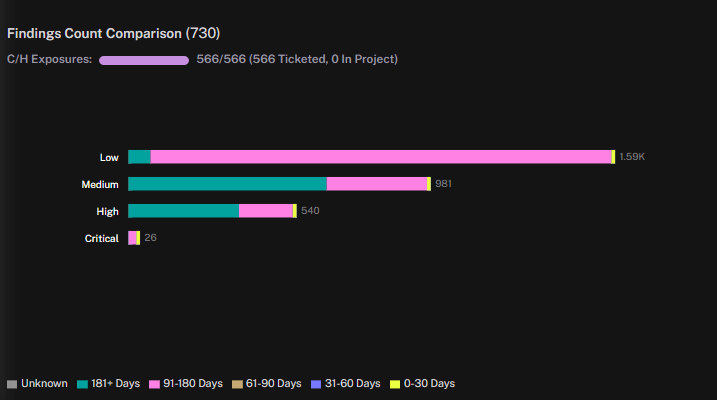
The Findings Count Comparison widget displays the total number of vulnerability findings, broken down by both severity and age. This view highlights not only how many findings exist at each severity level but also how long they have remained unresolved.
Severity Categories include Critical, High, Medium, and Low, each shown as a horizontal bar.
Bar Segments represent the age of findings, color-coded by time ranges
Counts are shown at the end of each bar to indicate the total findings for that severity.
Header Metric tracks critical and high exposures, showing how many have been ticketed or moved into projects.
By combining severity with age distribution, this widget helps teams identify vulnerabilities that have been open the longest, prioritize older critical and high findings, and ensure remediation timelines are aligned with organizational policies.
See Also: