You can find these options in the Exposure Analysis menu.
Overview
Exposure Analysis helps you estimate the risk-based exposure score (on a 1–100 scale) for a specific CVE on a given asset. It models how multiple factors, including asset attributes, vulnerability characteristics, threat intelligence, and the effectiveness of security controls, influence that score.
This tool offers a quick, “back-of-the-envelope” way to explore different what-if scenarios and understand how changes to these factors may affect exposure. Results are approximate and intended for exploratory analysis. They may differ from the actual exposure scores calculated for vulnerability instances in your environment, which use more detailed control mappings and context-specific data.
What You Can Do Here
Simulate risk impact for specific vulnerabilities using the Exposure Simulations interface.
Select a CVE and asset to define the scope of the simulation.
Adjust Asset Attributes to model contextual conditions.
Modify Vulnerability Analysis parameters to reflect exploitability and relevance.
Configure Threat Level to model different attacker intents.
Set Security Controls Efficacy and Validation to evaluate defensive posture.
Analyze calculated exposure in the Exposure Score Calculation panel.
Evaluate exposure dynamics over time using the Exposure Score with Age chart.
You can also see the walkthrough in this link
Asset Attributes
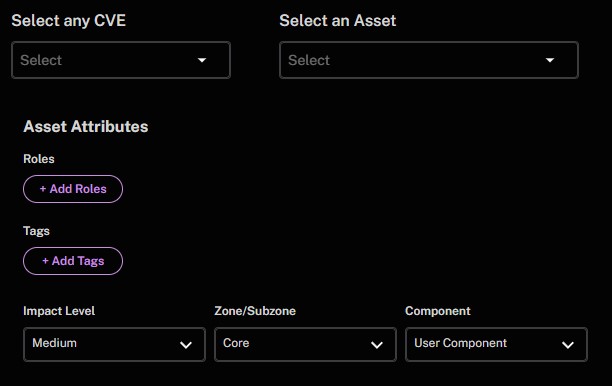
In this section you can select the CVE you want to include in the simulation, and a related asset. You can also select the role of the asset, and any tags. You can then proceed to indicate the impact level of the asset, the network zone/subzone, and the component (user component or kernel component).
Vulnerability Analysis
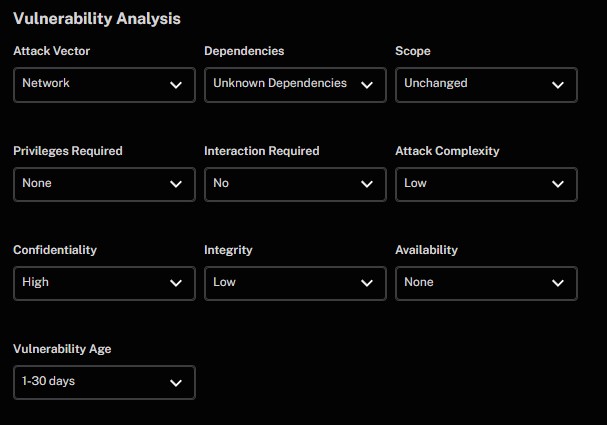
In the Vulnerability Analysis section, you can configure the following parameters:
Attack Vector
Dependencies
Scope
Privileges Required
Interaction Required
Attack Complexity
Confidentiality
Integrity
Availability
Vulnerability Age
Threat Level
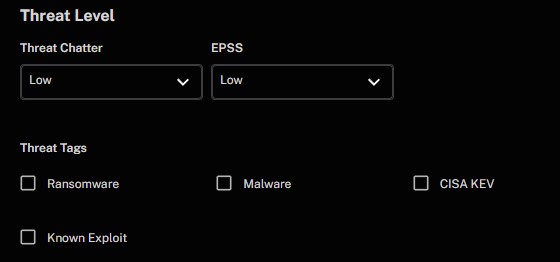
In this section you can configure the threat chatter level, as well as the EPSS level. You can also select the following threat tags: ransomware, malware, CISA KEV, known exploit.
Security Controls Efficacy and Validation
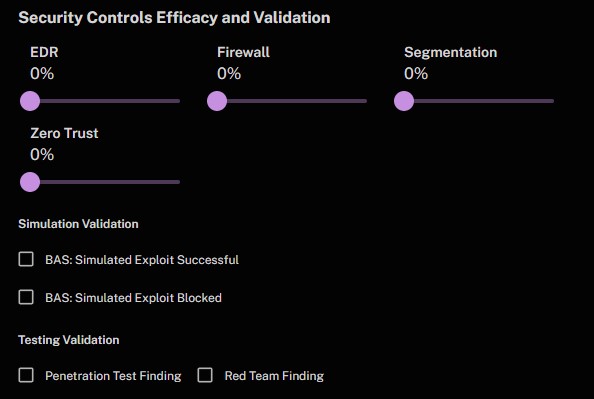
In this section you can configure the following parameters to simulate the efficacy of your controls in place:
EDR
Firewall
Segmentation
Zero Trust
Simulation Validation
Testing Validation
How To Use the Security Control Efficacy Sliders
Each slider (EDR, Firewall, Segmentation, Zero Trust) represents the assumed efficacy (effectiveness) percentage of that specific security control against the Tactics, Techniques, and Procedures (TTPs) associated with the vulnerabilities being analyzed, within a range of 0-100%:
0% = The control provides no mitigation
100% = The control fully mitigates the threat (resulting in Likelihood = 0% and Exposure Score = 1)
The sliders let you easily adjust control efficacy values to explore “what-if” scenarios:
Single control modeling: Adjust one slider to see the impact of deploying or improving that control
Layered defense modeling: Adjust multiple sliders simultaneously to see the combined effect of multiple controls
Comparison scenarios: Reset and adjust different combinations to compare security postures
The Exposure Analysis tool will recalculate the Exposure Score based on your adjustments, making it easy to demonstrate the value of security investments to stakeholders.
Important: All Controls Are Treated Equally in This Tool
In the Exposure Analysis modeling interface, all four control sliders have the same impact on the Exposure Score calculation. Moving EDR from 0% to 50% produces the same effect as moving Firewall, Segmentation, or Zero Trust from 0% to 50%. This simplified approach makes the tool easy to use for quick scenario modeling.
Exposure Score Calculation
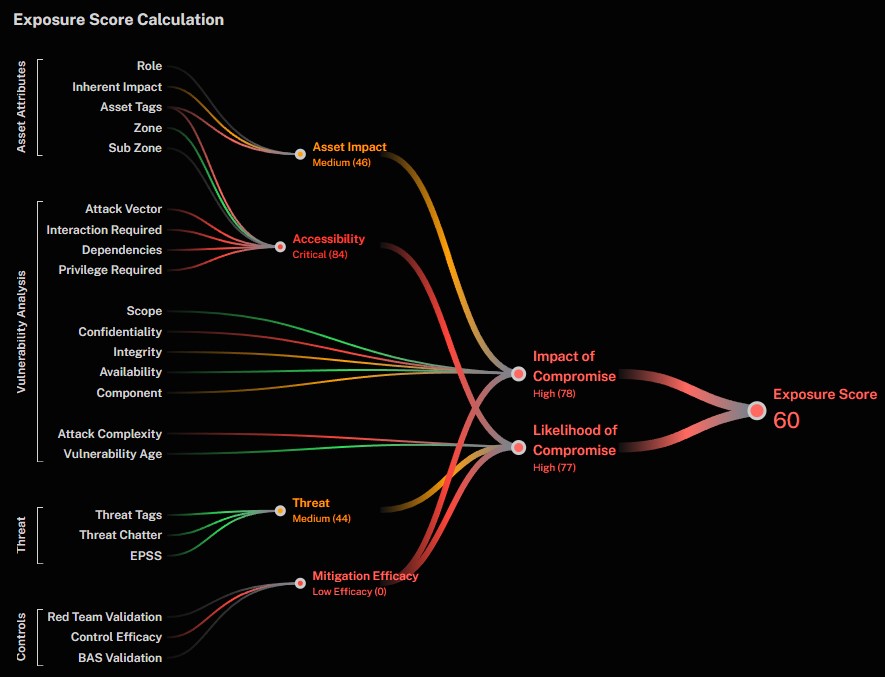
This section shows you the result of the simulation. It will show you the final Exposure Score resulting from the parameters you configured.
Input Parameters and Effect
Section | Parameter | Description | Effect |
|---|---|---|---|
Asset Attributes | Role | Business roles associated with the asset (e.g., RDP, Admin) | Directly influences severity calculations through role-based impact weights |
Asset Attributes | Tags | Asset classification tags (e.g., BU Sales, Marketing, Environment/Office), Base asset impact rating | Used for asset categorization and reporting |
Asset Attributes | Impact Level | Base asset impact rating | Forms foundation for impact score calculation |
Asset Attributes | Zone/Subzone | Network segmentation location (e.g., Perimeter, Core, Air gapped) | Significantly affects accessibility scores; deeper zones reduce exposure |
Asset Attributes | Component | System component type (e.g., User Component, Kernel) | Kernel components increase severity score; user components have baseline severity |
Vulnerability Analysis | Attack Vector | Initial access method (e.g., Network, Local) | Remote vectors increase accessibility; local vectors reduce exposure |
Vulnerability Analysis | Dependencies | Required preconditions (e.g., Known Dependencies) | Additional dependencies decrease likelihood |
Vulnerability Analysis | Scope | Impact scope (e.g., Unchanged, Changed) | Changed scope increases severity rating |
Vulnerability Analysis | Privileges Required | Access level needed (None, Low, High) | Higher privileges decrease likelihood score |
Vulnerability Analysis | Interaction Required | User interaction needs (None, Required) | Required interaction reduces exposure score |
Vulnerability Analysis | Attack Complexity | Exploitation difficulty (Low, High) | Higher complexity reduces likelihood score |
Vulnerability Analysis | CIA Ratings | Confidentiality, Integrity, Availability impact levels | Directly influences severity calculation |
Threat Level | Threat Chatter | Observed threat actor interest (0-100) | Higher chatter increases threat score |
Threat Level | EPSS | Exploit probability scoring (0-1) | Directly influences threat calculation |
Threat Level | Threat Tags | Associated threat categories (e.g., Ransomware, CISA KEV) | CISA KEV maximizes visibility; other tags increase threat score |
Security Controls | Control Efficacy | Effectiveness ratings for security controls (0-100%) | Directly reduces likelihood through mitigation factor |
Security Controls | Validation | BAS and Red Team testing results | Failed tests override control efficacy; successful tests confirm effectiveness |
Security Controls | Segmentation | Network isolation controls | Provides up risk reduction when properly implemented |
Exposure Score with Age
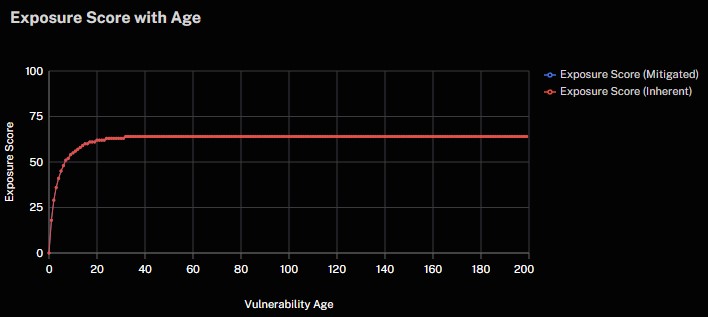
The graph plots Exposure Score against Vulnerability Age (in days), demonstrating how the cybersecurity risk evolves over time. It shows two potential measures: Exposure Score (Inherent) in red and Exposure Score (Mitigated) in blue.
Use of the Exposure Analysis Tool
Modeling Tool vs. Production Calculation
Exposure Analysis is a “back-of-the-envelope” analysis tool that allows you to model different scenarios in real time with some level of approximation. It should not be confused with how Balbix calculates exposure score for your actual vulnerability instances, which is more complete and comprehensive.
How Balbix Actually Calculates Exposure Score
In our standard pipeline, Balbix:
Automatically maps every CVE to its associated TTPs
Derives control efficacy values from authoritative sources like MITRE Engenuity evaluations
Evaluates control efficacy based on which specific TTPs each control is effective against (e.g., EDR is more effective against execution/persistence TTPs, while Firewall is more effective against C2/exfiltration TTPs)
Calculates efficacy for each vulnerability instance on each asset
Factors in additional context: vulnerability tags (CISA KEV, Ransomware, etc.), asset role, network zone, business context, and threat intelligence
See Also: