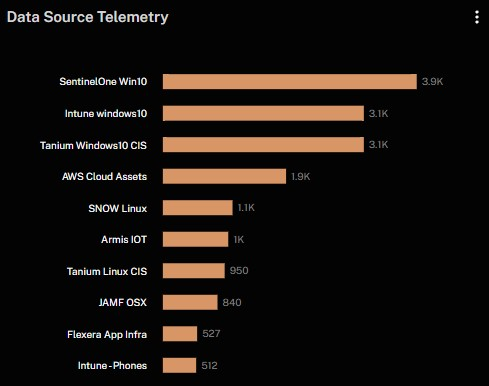
The Data Source Telemetry widget shows how many assets are being contributed by each connected data source in your environment. Each bar represents the volume of telemetry coming from a specific connector, allowing you to assess the coverage, relevance, and activity level of each source. This helps ensure that your telemetry architecture is functioning as expected and that critical tools are providing sufficient visibility.
You can use this widget to validate the performance and integration status of your data sources. If a source expected to cover a large asset group is reporting low or no telemetry, it may indicate a misconfiguration, data ingestion issue, or lack of deployment coverage. Conversely, sources reporting high volumes suggest strong integration and active asset tracking.
This view also supports optimization of your data ecosystem. By understanding which platforms are contributing the most telemetry, you can identify overlap, fill gaps, and ensure that all major asset types—such as endpoints, cloud infrastructure, mobile devices, and IoT—are being accurately monitored.
See Also: