Purpose
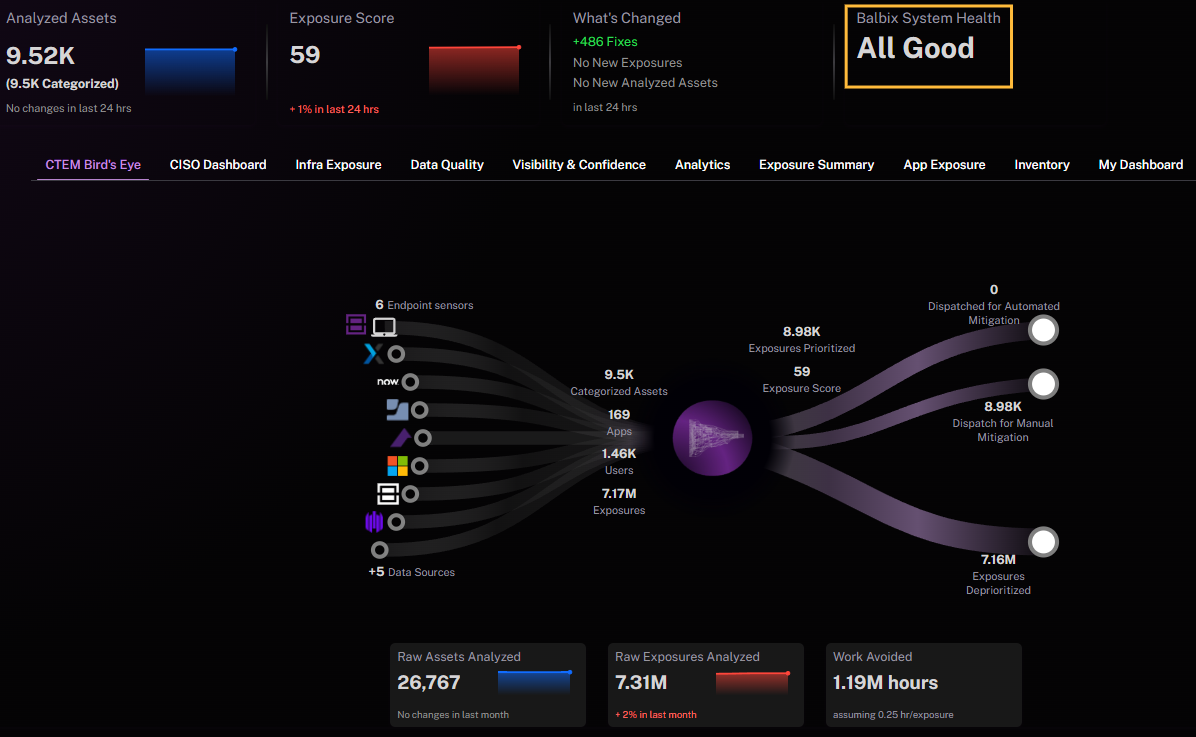
The Balbix System Health widget summarizes the operational health of your tenant’s data pipeline so you can quickly spot data quality gaps and freshness problems. It evaluates Telemetry Health, Connector Health, and Sensor Health, then assigns an overall status based on the most degraded one.
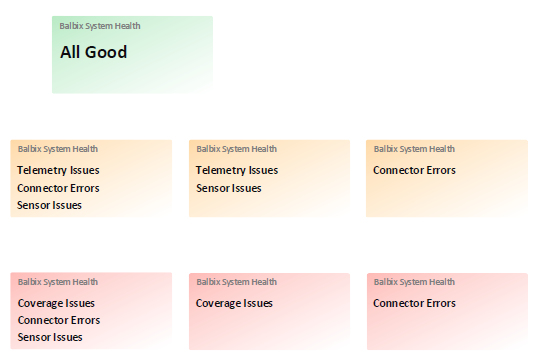
Sample states:
How it is calculated
1) Telemetry Health
Telemetry Health measures data quality and coverage using:
included / (included + other_excluded)
Status thresholds:
Good: ratio ≥ 0.80
Fair: 0.50 < ratio < 0.80
Poor: ratio ≤ 0.50
When the system is ingesting new data for the first time, or immediately after you add a new connector, Coverage Health is temporarily treated as Good to tolerate expected short term fluctuations.
2) Connector Health
Connector Health looks at scheduled connectors over the last 24 hours:
Good: all scheduled connectors ran without errors in the last 24 hours
Fair: fewer than 25 percent of scheduled connectors failed
Poor: more than 25 percent of scheduled connectors failed
Non scheduled connectors are ignored.
3) Sensor Health
Sensor Health reflects whether host or network sensors are reporting:
Good: more than 80 percent of known sensors reported without errors in the last 24 hours
Fair: fewer than 40 percent of sensors failed to report
Poor: more than 40 percent of sensors failed to report
If sensors are not configured, or the number of sensors is less than 10 percent of the number of assets, Sensor Health is treated as Green.
Overall System Health
The overall System Health color equals the minimum status across Telemetry, Connector, and Sensor health.
Data freshness checks
A Data Refresh Needed banner appears when data is stale:
If the last successful ingest by a flex or API connector was more than 4 days ago
If the last manual ingest by a flex or API connector was more than 7 days ago
These checks can trigger even if category statuses are Green.
UI behavior
D3 presents tiles such as All Good, Telemetry Issues, Connector Errors, Sensor Issues, and Coverage Issues. Hovering a tile shows a hint to click for details. Clicking navigates to the Data Sources page.