The Balbix Exposure Analysis tool provides a powerful mechanism for quantifying and analyzing cyber risk associated with specific vulnerabilities within a given environmental context. This document outlines use cases designed for implementation within the tool’s defined parameters. By structuring use cases based on primary analytical intent—Quantification, Impact Analysis, and Comparison—and mapping them directly to the tool’s configurable inputs (Asset Attributes, Vulnerability Analysis, Threat Level, Security Controls), users can systematically leverage the tool to derive actionable insights.
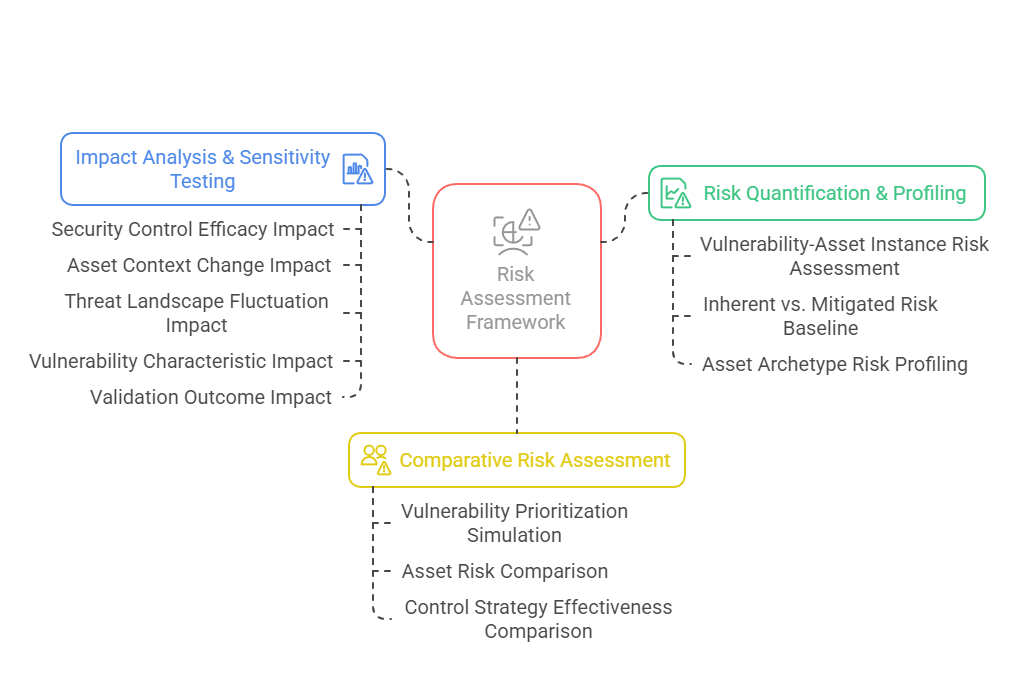
1. Risk Quantification & Profiling
This category encompasses use cases focused on establishing a calculated risk baseline for specific scenarios. The primary objective is to leverage the tool's comprehensive analysis capabilities to assign a precise Exposure Score to a vulnerability instance, asset archetype, or to differentiate between inherent and mitigated risk levels under defined conditions.
1.1. Vulnerability-Asset Instance Risk Assessment
Purpose: Determine the calculated Exposure Score for a specific CVE on a specific (or representative) asset with defined attributes.
Tool Implementation: Select CVE, Asset (optional, attributes defined), configure all relevant parameters (Asset Attributes: Role, Tags, Impact Level, Zone, Component; Vulnerability Analysis: CVSS metrics, Age; Threat Level: Chatter, EPSS, Tags; Security Controls efficacy). Observe final Exposure Score.
Business Outcome:
Decisions: Prioritize this specific vulnerability instance for remediation based on its quantified risk score relative to others or organizational thresholds. Decide if immediate action is warranted or if risk can be accepted/deferred.
Actions: Initiate patching/remediation workflow if score is high. Formally document risk acceptance if score is low and deemed acceptable. Add to a tracked remediation backlog based on score.
Results: Focused remediation on verifiably high-risk instances, justifiable resource allocation, quantifiable baseline for tracking risk reduction progress on specific CVE-asset pairs.
1.2. Inherent vs. Mitigated Risk Baseline
Purpose: Understand the baseline risk (Inherent) and the risk considering current controls (Mitigated) for a specific scenario.
Tool Implementation: Configure scenario as per 1.1. Observe the difference between the conceptual 'inherent' score (implied before Mitigation Efficacy factor) and the final calculated score. Also, observe the Inherent vs. Mitigated lines on the 'Exposure Score with Age' graph.
Business Outcome:
Decisions: Assess the effectiveness of the current control stack for the simulated scenario. Decide if existing controls provide sufficient risk reduction. Identify areas where controls are underperforming relative to inherent risk.
Actions: Justify continued investment in effective controls. Initiate investigations or improvement plans for controls showing low mitigation efficacy. Communicate the value of security controls by showing the reduction from inherent risk.
Results: Data-driven validation of security control ROI, identification of control gaps or tuning opportunities, improved communication of risk posture (potential vs. actual).
1.3. Asset Archetype Risk Profiling
Purpose: Profile the typical risk level for a class of assets (e.g., critical database servers, perimeter web servers) facing a representative high-impact vulnerability.
Tool Implementation: Select a representative CVE. Define Asset Attributes typical for the archetype (e.g., High Impact Level, Core Zone, Admin Role). Configure relevant Vulnerability, Threat, and Control parameters. Observe the Exposure Score as a representative profile.
Business Outcome:
Decisions: Establish expected risk tolerance baselines for critical asset groups. Inform the definition of security policies and minimum baselines for these archetypes. Decide if standard controls are adequate for the archetype.
Actions: Develop or update security hardening standards specific to asset archetypes (e.g., database servers, domain controllers). Tailor monitoring rules and alerting thresholds based on the archetype's risk profile. Allocate patching resources based on archetype criticality.
Results: Consistent security posture across similar assets, proactive risk management for critical infrastructure groups, efficient application of security standards.
2. Impact Analysis & Sensitivity Testing
Use cases within this group aim to explore the sensitivity of the calculated Exposure Score to changes in specific input parameters. By systematically altering variables related to asset context, threat intelligence, vulnerability characteristics, or control effectiveness, users can determine which factors most significantly influence risk, thereby identifying key drivers and potential points of intervention.
2.1. Security Control Efficacy Impact
Purpose: Evaluate how changing the assumed effectiveness of specific security controls (EDR, Firewall, Segmentation, Zero Trust) impacts the Exposure Score for a given vulnerability/asset scenario.
Tool Implementation: Configure a baseline scenario (1.1). Systematically adjust the sliders (%) for EDR, Firewall, Segmentation, Zero Trust under 'Security Controls Efficacy'. Observe the change in the final Exposure Score and the 'Mitigation Efficacy' component in the calculation visualization.
Business Outcome:
Decisions: Identify which controls provide the most significant risk reduction for the scenario. Determine the point of diminishing returns for improving a specific control. Prioritize investments in control improvements or tuning.
Actions: Focus resources on enhancing/tuning the most impactful controls. Justify budget requests for specific security technologies based on simulated risk reduction potential. Set realistic performance targets for security controls.
Results: Optimized security spending, targeted improvements leading to greater risk reduction, data-driven vendor/tool selection or renewal justification.
2.2. Asset Context Change Impact
Purpose: Simulate how changes to an asset's context (e.g., moving it from Perimeter to Core zone, elevating its role, changing its component type) affect its exposure score for a specific vulnerability.
Tool Implementation: Configure a baseline scenario (1.1). Modify specific 'Asset Attributes' (Zone/Subzone, Role, Component, Impact Level). Observe the change in the Exposure Score, particularly noting impacts on 'Asset Impact' and 'Accessibility' in the calculation visualization.
Business Outcome:
Decisions: Evaluate the risk implications before deploying assets into sensitive zones, assigning critical roles, or changing impact ratings. Decide if proposed changes are acceptable from a risk perspective or require additional compensating controls.
Actions: Approve/deny/modify change requests based on simulated risk impact. Mandate specific security prerequisites (e.g., hardening, scanning) before allowing context changes. Update CMDB or asset inventory based on risk implications of context.
Results: Risk-aware change management process, prevention of inadvertent risk increases due to architectural changes, better alignment between asset context and required security posture.
2.3. Threat Landscape Fluctuation Impact
Purpose: Assess how changes in the threat landscape (e.g., increased threat chatter, exploit becoming known/added to CISA KEV, change in EPSS score) impact the exposure score for an existing vulnerability/asset.
Tool Implementation: Configure a baseline scenario (1.1). Modify parameters under 'Threat Level' (Threat Chatter slider, EPSS slider, Threat Tags checkboxes like Known Exploit, CISA KEV). Observe the change in the Exposure Score, noting impact on the 'Threat' component in the calculation visualization.
Business Outcome:
Decisions: Determine the urgency of remediation based on dynamic threat context (e.g., vulnerability added to CISA KEV, high EPSS score). Decide when to trigger incident response or heightened monitoring based on threat intel changes.
Actions: Escalate patching priority for vulnerabilities when associated threat intel indicates higher risk. Adjust threat hunting activities based on simulated impact of chatter/tags. Communicate emerging threat impacts to stakeholders proactively.
Results: Agile response to evolving threats, reduced exposure time for newly exploited vulnerabilities, prioritization informed by real-world exploitability and attacker interest.
2.4. Vulnerability Characteristic Impact (CVSS Sensitivity)
Purpose: Understand how specific CVSS vector components (e.g., Attack Vector changing from Local to Network, Privileges Required changing from High to None) influence the Exposure Score.
Tool Implementation: Configure a baseline scenario (1.1). Modify specific parameters under 'Vulnerability Analysis' (Attack Vector, Privileges Required, Interaction Required, Attack Complexity, Scope, CIA Ratings). Observe the change in the Exposure Score, noting impacts on 'Accessibility' and 'Impact of Compromise' in the calculation visualization.
Business Outcome:
Decisions: Refine internal prioritization logic beyond just the base CVSS score, weighting factors identified as highly sensitive in the simulation (e.g., Network accessibility). Decide which compensating controls are most relevant based on the specific risk drivers.
Actions: Prioritize remediation based not just on score but on the presence of high-impact characteristics (e.g., low complexity, no interaction needed). Design and implement compensating controls that directly address the key risk drivers (e.g., MFA if Privileges Required=None is a driver).
Results: More accurate, context-aware vulnerability prioritization, better understanding of why something is risky, more effective compensating control strategies.
2.5. Validation Outcome Impact
Purpose: Simulate the risk impact if validation testing (BAS, Pen Test, Red Team) confirms exploitability or control failure for a scenario.
Tool Implementation: Configure a baseline scenario (1.1). Select checkboxes under 'Simulation Validation' or 'Testing Validation'. Observe the effect on the final score (implicitly overriding or confirming control efficacy).
Business Outcome:
Decisions: Quantify the confirmed risk level when testing validates a vulnerability or bypasses a control. Prioritize remediation based on empirical evidence from testing, potentially overriding lower theoretical scores. Assess the true effectiveness of deployed controls.
Actions: Trigger immediate remediation for any vulnerability validated by testing (e.g., BAS success, Pen Test finding). Investigate and fix controls that failed validation. Update assumed control efficacy ratings in the tool based on real-world test results.
Results: High-confidence prioritization based on proven risk, validation (or invalidation) of security control effectiveness, closed-loop process integrating testing results into risk assessment.
3. Comparative Risk Assessment
This section focuses on use cases where the tool is employed to compare the relative risk posed by different elements. Whether comparing vulnerabilities against each other, evaluating the risk of the same vulnerability across diverse assets, or assessing the risk reduction potential of various control strategies, these simulations provide a quantitative basis for prioritization and strategic decision-making.
3.1. Vulnerability Prioritization Simulation
Purpose: Compare the simulated Exposure Scores of different CVEs on the same representative asset to inform prioritization.
Tool Implementation: Define a standard representative asset (attributes). Run separate simulations (as per 1.1) for different CVEs, keeping asset attributes, threat context (potentially), and controls constant. Compare the resulting Exposure Scores.
Business Outcome:
Decisions: Decide which of several vulnerabilities affecting a critical asset/group poses the greatest risk and should be addressed first. Allocate limited patching/remediation windows effectively.
Actions: Create rank-ordered remediation lists based on comparative simulation scores. Justify prioritization decisions to stakeholders and operations teams. Defer action on lower-scoring vulnerabilities when resources are constrained.
Results: Optimized vulnerability management workflow, faster reduction of the highest actual risks, demonstrably risk-based patching strategy.
3.2. Asset Risk Comparison
Purpose: Compare the simulated Exposure Scores for the same CVE across different asset types or contexts (e.g., same CVE on a dev server vs. a production server).
Tool Implementation: Select a specific CVE. Run separate simulations, modifying only the 'Asset Attributes' (Impact Level, Role, Zone etc.) to represent the different assets. Compare the resulting Exposure Scores.
Business Outcome:
Decisions: Understand and quantify why the same vulnerability is more dangerous on certain assets (e.g., production vs. dev, core vs. perimeter). Decide whether different remediation SLAs or control requirements are justified based on asset context.
Actions: Apply differentiated remediation timelines based on simulated risk per asset context. Implement targeted compensating controls only where the simulation shows significantly higher risk. Use results to advocate for better asset segmentation or context management.
Results: Context-sensitive risk management, efficient resource allocation, more accurate representation of overall organizational risk.
3.3. Control Strategy Effectiveness Comparison
Purpose: Compare the risk reduction potential of improving different security controls for a specific high-risk scenario.
Tool Implementation: Configure a high-risk baseline scenario (1.1). Run separate simulations, each time increasing the efficacy slider for one control (e.g., simulate improving EDR vs. improving Segmentation) while keeping others constant. Compare the resulting decrease in Exposure Score.
Business Outcome:
Decisions: Decide which potential security improvement projects (e.g., investing in EDR tuning vs. network segmentation project vs. Zero Trust initiative) will yield the greatest risk reduction for key scenarios. Inform strategic security planning and budgeting.
Actions: Prioritize funding and resources for control improvements demonstrated by simulation to be most effective. Build business cases for security investments using quantified risk reduction estimates. Deprioritize or re-evaluate investments in controls showing low impact in relevant scenarios.
Results: Maximized ROI for security investments, data-driven security roadmap, clear justification for strategic security decisions to executive leadership.