Overview
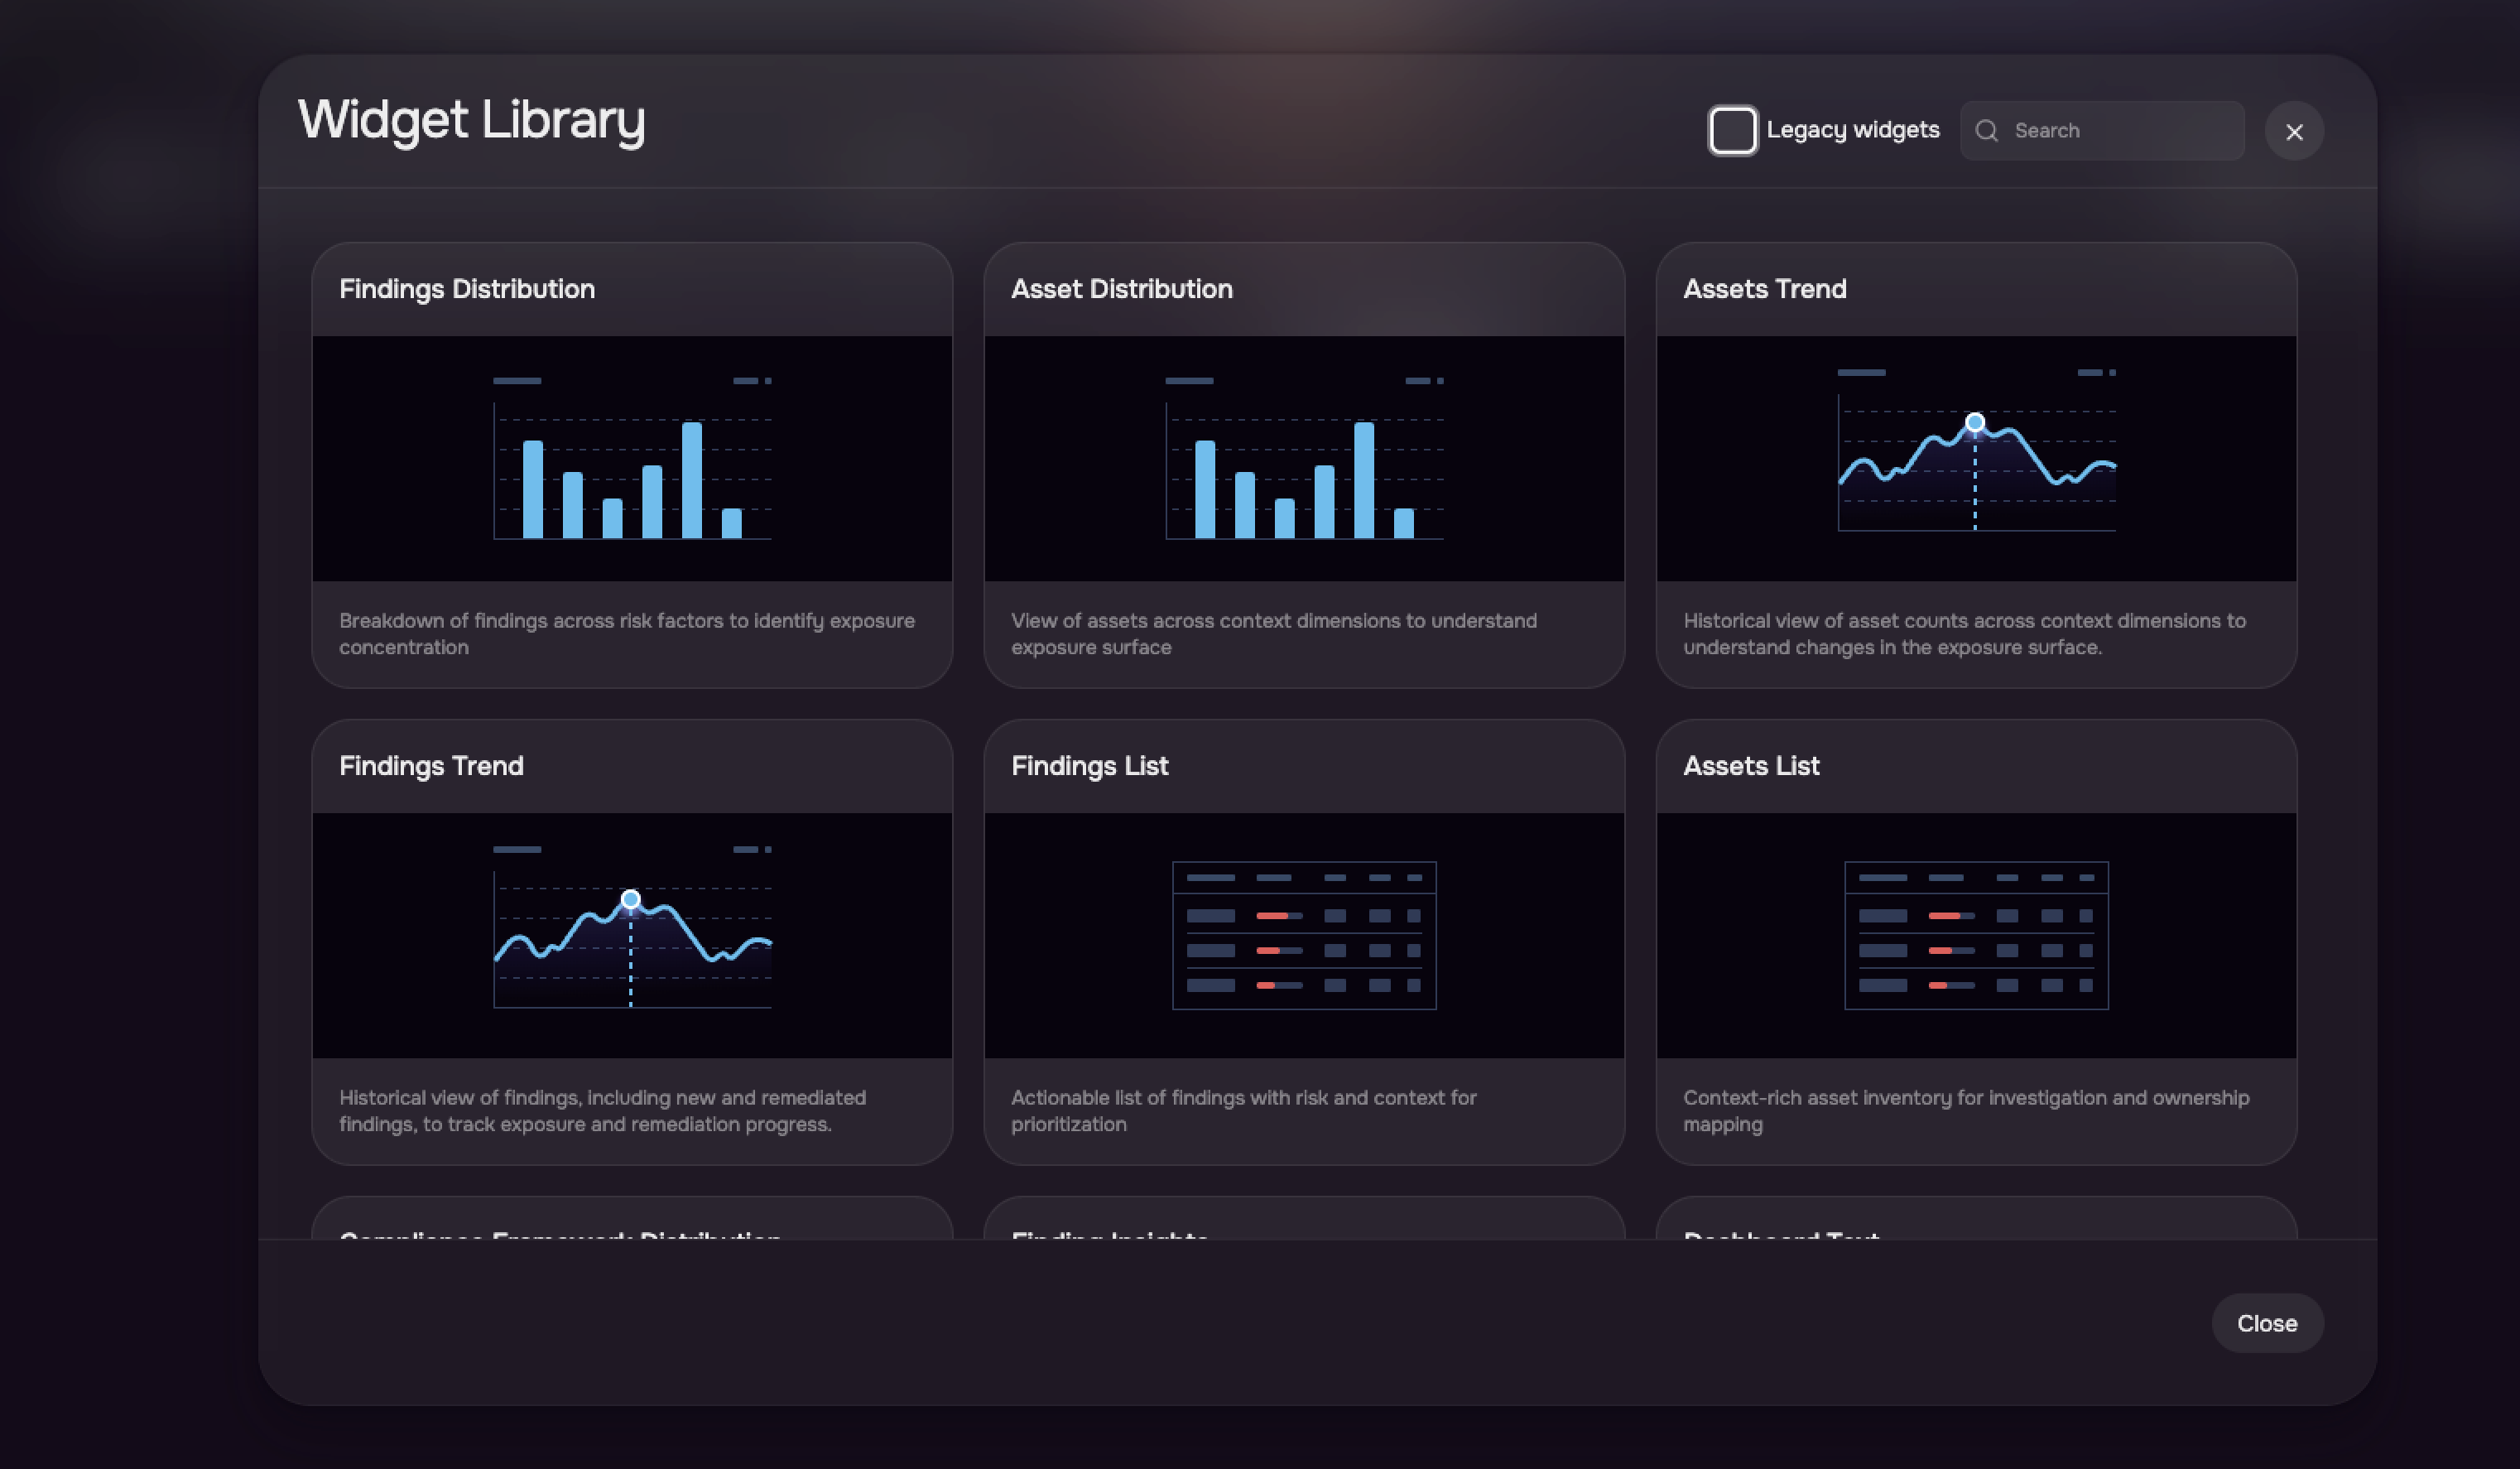
The SAFE CTEM Dashboard now supports Trend Widgets that provide historical time-series visibility into asset and finding counts over time. Trending widgets enable security teams to monitor changes in their exposure posture, measure remediation progress, and communicate measurable outcomes to leadership — all without leaving SAFE.
Key Capabilities
Assets Trend Widget: Historical view of total asset counts over time, with optional breakdowns by source, criticality, type, subtype, or groups.
Findings Trend Widget: Historical view of total findings and new findings (first observed on a given day), with optional breakdowns by status, source, severity, age of CVE, age of finding, or groups.
Unique Findings Metric: Toggle to display distinct finding counts alongside total assessment counts.
Chart Types: Line and Bar chart visualizations.
Time ranges: 7 Days, 1 Month, 3 Months, 6 Months, and 1 Year default views with up to 13 months of historical data.
Data capture: Automated daily snapshots ensure trend data is available without manual export or external tooling.
Smart Deduplication: Identical widget configurations are automatically reused to optimize backend processing.
Trend Widgets
SAFE supports two trend widget types:
Widget | Purpose |
|---|---|
Assets Trend | Displays historical asset counts over time |
Findings Trend | Displays historical finding counts and newly discovered findings over time |
Assets Trend Widget
The Assets Trend widget displays historical asset inventory counts based on the selected filters and configuration.
Trend Metric: Total Assets
Displays the total number of assets matching the configured filters for each daily snapshot.
Breakdown Options
An optional breakdown can be applied to split the total asset count into dimensional sub-series. When a breakdown is selected, the chart displays the top 5 values for that dimension.
Breakdown | Description | Filter Requirement |
|---|---|---|
None | Single total line/bar showing aggregate asset count | — |
Asset Source (Contributing Source) | Split by the integration/source that contributed the asset | Source filter mandatory (up to 5 sources) |
Asset Criticality | Split by Critical / High / Medium / Low | — |
Asset Type | Split by Server, Workstation, Cloud, etc. | — |
Asset Subtype | Split by asset sub-classification | — |
Groups | Split by group membership | Group filter mandatory (up to 5 groups) |

Findings Trend Widget
The Findings Trend widget displays historical finding count data with configurable trend dimensions.
Trend Metrics
Number of Findings (Total): Displays the total number of finding assessments matching the configured filters on each snapshot date.
New Findings: Displays findings that were observed for the first time on a given snapshot date.
Note
"New Findings" refers to the first time a finding was observed within SAFE. It does not represent the CVE publication date.
Breakdown Options
An optional breakdown can be applied to split the finding count into dimensional sub-series. When a breakdown is selected, the chart displays the top 5 values for that dimension.
Breakdown | Description | Filter Requirement |
|---|---|---|
None | Single total line/bar showing aggregate finding count | — |
Finding Status | Split by Open, Mitigated, etc. | — |
Finding Source (Contributing Source) | Split by the integration/source that reported the finding | — |
Finding Severity | Split by Critical / High / Medium / Low | — |
Age of CVE | Split by CVE publication age buckets | — |
Age of Finding | Split by finding observation age buckets | — |
Groups | Split by group membership (Line chart only) | Group filter mandatory (up to 5 groups) |
Unique Findings Toggle
When the Show Unique Findings checkbox is enabled, the widget displays a secondary metric showing the distinct finding count (unique findings across assets) alongside the total assessment count. This helps distinguish between the number of unique vulnerabilities and the total number of affected asset-finding pairs.

Widget Configuration Options
Chart Type
Chart Type | Description |
|---|---|
Line | Continuous line chart connecting daily data points. Supports all breakdowns including Groups. |
Bar | Vertical bar chart showing daily data points. Groups breakdown is not available for Bar charts. |
Time Range
The time range determines how far back the trend data is displayed by default. Users can select from the following periods:
Time Range | Description |
|---|---|
7 Days | Last 7 calendar days |
1 Month | Last 30 calendar days |
3 Months | Last 90 calendar days |
6 Months | Last 180 calendar days |
1 Year | Last 365 calendar days |
Note
The following widget properties can be modified after the widget has been saved to the dashboard:
Widget Name
Chart Type
Default Time Range
Other configuration (Trend By, Breakdown, Filters, Groups) are fixed at widget creation time and cannot be modified. To change these, delete the widget and create a new one.
Data Behavior & Display
Daily Snapshot Aggregation
Trend data is captured via automated daily snapshots. The system processes all active widget configurations once per day.
Each snapshot reflects the state of assets and findings at the time of daily processing.
Historical data begins accumulating from the day the widget configuration is created.
Hovering over any data point on the chart displays the exact count and date for that snapshot.
Missing Data Handling
Scenario | Line Chart Behavior | Bar Chart Behavior |
|---|---|---|
Data missing for start dates | Skip the date — chart begins at first available point | Skip the date — no bar displayed |
Data missing for end dates | Skip the date — chart ends at last available point | Skip the date — no bar displayed |
Data missing in between (technical gap) | Connect adjacent available points with a dotted line | Skip the date — no bar displayed for missing days |
Widget Limitations
Constraint | Limit | Description |
|---|---|---|
Maximum widgets per tenant | 50 | Each tenant can have up to 50 active trend widget configurations. Attempting to create a 51st widget will return an error. Delete unused widgets to free capacity. |
Maximum historical data | 13 months | Trend data is retained for up to 13 months. The maximum queryable date range is 13 months from today. |
Data freshness | Up to 24 hours | Trend data reflects daily snapshots. The most recent data point is from the last completed daily aggregation cycle. Real-time data is not available in trend widgets. |
Breakdown dimension limit | Top 5 values | Breakdown charts display only the top 5 values for the selected dimension. Values beyond the top 5 are not individually charted. |
Group filter limit | Up to 5 groups | Group-scoped widgets can include a maximum of 5 groups. |
Source filter limit (Assets Trend) | Up to 5 sources | Source breakdown on Assets Trend requires selecting up to 5 contributing sources. |
End date constraint | Today or earlier | The trend data end date cannot be in the future. |
Configuration immutability | — | Trend By, Breakdown, Filters, and Group selections cannot be modified after creation. Only Name, Chart Type, and Default Time Range are editable. |
Data Availability
No historical backfill: Trend data starts accumulating from the day the widget is created. There is no retroactive backfill of historical data prior to widget creation.
Deleted widgets: Deleting a widget removes it from the dashboard. Historical snapshot data is retained internally but is not accessible once the widget is deactivated.
Duplicate detection: If you create a widget with identical configuration (same type, breakdown, filters, and groups) to an existing active widget, the system automatically reuses the existing data instead of creating a duplicate. You will see a Live Preview immediately in this case.
Groups Breakdown Restriction
The Groups breakdown is only available on Line charts. It is not supported for Bar chart type.