Release Notes - Mar 2024
- 12 Minutes to read
- Print
- PDF
Release Notes - Mar 2024
- 12 Minutes to read
- Print
- PDF
Article summary
Did you find this summary helpful?
Thank you for your feedback
What's New in SAFE One
1. 70+ Integrations in SAFE One
SAFE supports 70+ integrations to discover and onboard assets and their respective signals (vulnerabilities and misconfigurations) in SAFE.
List of Supported Integration in SAFE One
Azure - Defender for Cloud | ServiceNow | Microsoft Defender for Cloud Apps | Okta - SSO |
CrowdStrike Falcon | Zoom | Microsoft Defender for Identity | Grafana Labs |
Microsoft 365 Exchange Online | SentinelOne | Microsoft Information Protection | Auth0 |
Rapid7 InsightVM | Tenable Security Center | Microsoft Intune | Dynatrace |
Tenable VM | AWS | M365 - Zoom | Veracode |
KnowBe4 | GCP | Asana | Document360 |
VA Report Upload | Azure AD SSO | Cisco Umbrella | Snowflake Enterprise |
Azure Active Directory | Malware Patrol | LastPass | DocuSign |
Microsoft 365 (Office 365) | Shodan | Bitbucket | Cloudflare |
Qualys SCA | SecurityTrails | Fastly | Microsoft 365 Defender |
Qualys VMDR | Google Workspace | JumpCloud | Databricks |
Tanium | Crowdstrike Spotlight | Jamf Cloud | M365 - ServiceNow |
Microsoft SharePoint | Microsoft Defender for Endpoints | Datadog | Microsoft App Governance |
Microsoft Teams | M365 - Citrix ShareFile | Sentry | DocuSign |
Phishing Report Upload | M365 - DocuSign | GitHub | M365 - Salesforce |
Imperva WAF | M365 - GitHub | GitLab | Atlassian Opsgenie |
Wiz | M365 - Okta | CyberArk Workforce Identity | |
Azure AD User Provisioning |
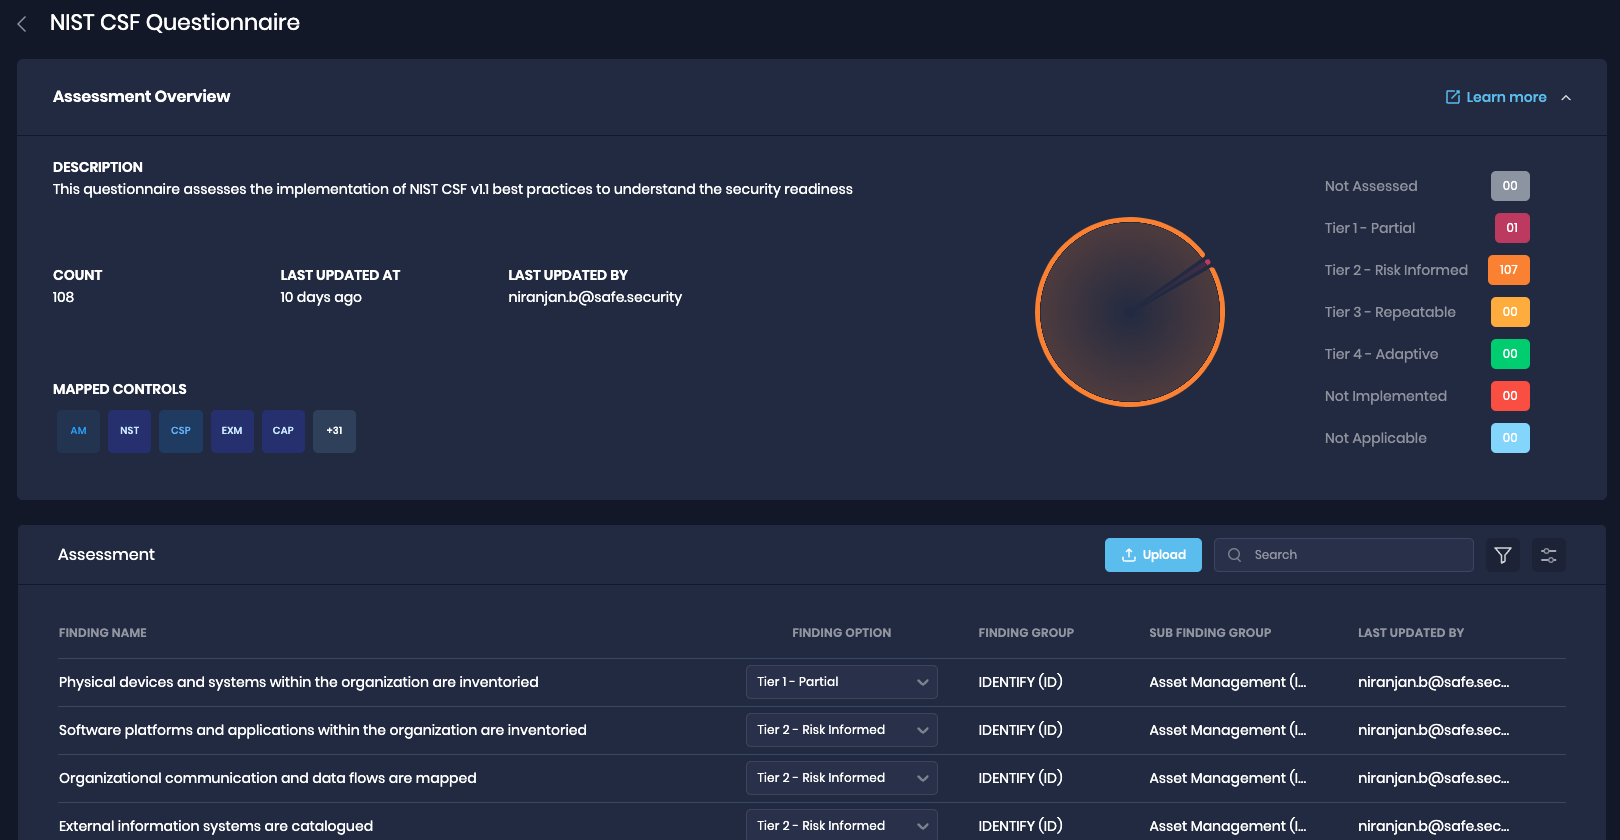
2. NIST CSF v1.1 Questionnaire to assess FAIR-CAM controls
SAFE supports assessing FAIR-CAM controls using a NIST CSF questionnaire.
For each Group, FAIR-CAM controls are assessed to provide a risk perspective unique to that group. NIST CSF questionnaires can be uploaded to mark the maturity of the FAIR-CAM controls, especially the capability maturity level.
3. Automated External Attack Surface Management
An automated Outside-In telemetry for an organization has been added to SAFE, by default.
SAFE enumerates the entire digital footprint (entity attribution) using the primary domain. It auto-onboards IPs and Domains based on all the external facing attack surfaces and then assesses them.The Outside-in assessment in SAFE includes:
External email security assessment using the primary domain
Enumerate the entire digital footprint (entity attribution) using the primary domain
Web Application Security Headers Assessment
TLS/SSL Misconfigurations and Certificate Issues
Open Ports Exposures
Malware Servers Assessments
Assessment of DNS Security and TypoSquat Domains
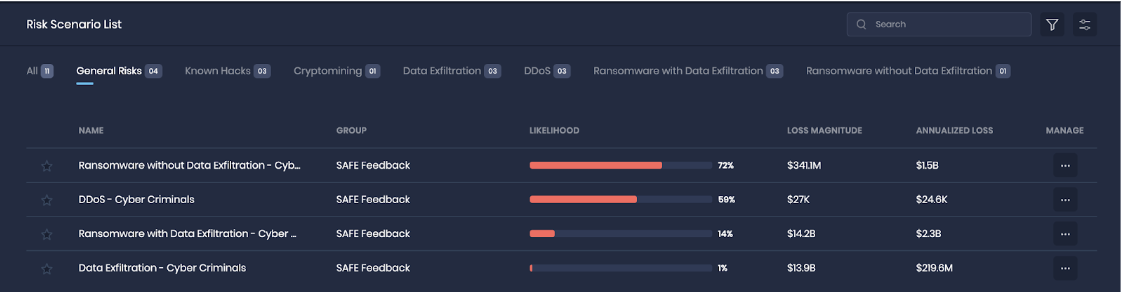
4. Out-of-the-box (OOTB) Risk Scenario Library
All the Risk Scenarios are fully FAIR compliant. We've added a few additional attributes and refined the definition of Risk Scenarios to generate Likelihood, Loss Magnitude, and Annualized Loss outputs. One significant feature is the Out-of-the-box (OOTB) Risk Scenario Library, which is now an integral part of SAFE and built upon the FAIR methodology. This library offers a wide range of pre-defined Risk Scenarios to expedite your risk assessment process.
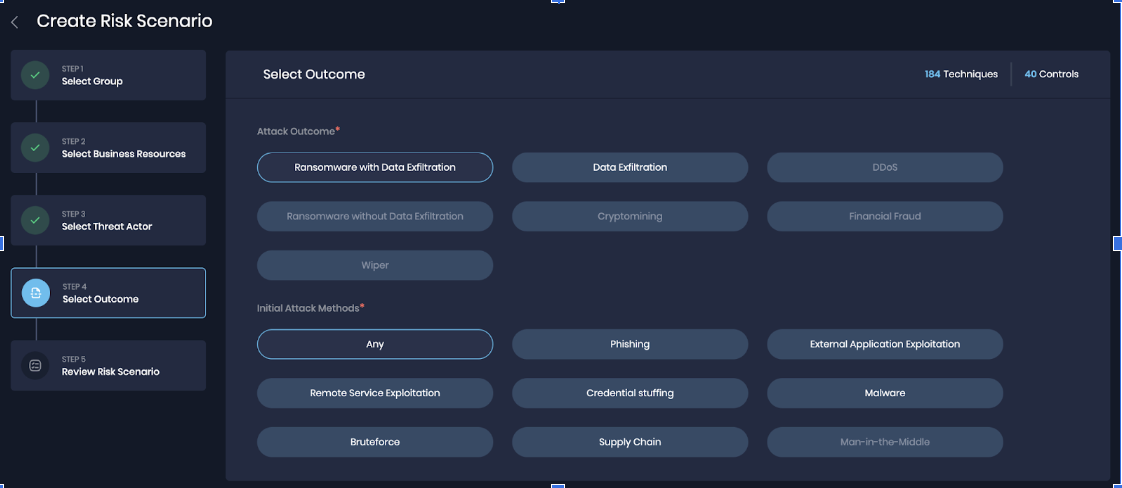
5. BYOR: Build your Own Risk Scenario
We are introducing a new process for the creation and management of Risk Scenarios in SAFE, empowering users to align their risk assessment with the FAIR methodology. This release allows the definition of multiple Risk Scenarios based on selected Business Resources, Threat Actors, Attack Outcomes, and Initial Attack Methods on a per-group basis.
We are introducing a 5-step, wizard-based, custom Risk Scenario creation process. This intuitive and user-friendly workflow simplifies the process as follows:
Select Group: Choose the group to which the scenario belongs.
Review Business Resource: Identify the relevant business resource for the scenario.
Select Threat Actor: Define the threat actor involved in the scenario.
Select Attack Outcome and Initial Attack Method: Specify the attacker behaviors related to the scenario.
Review and Create the Scenario: Review your selections and create the scenario.
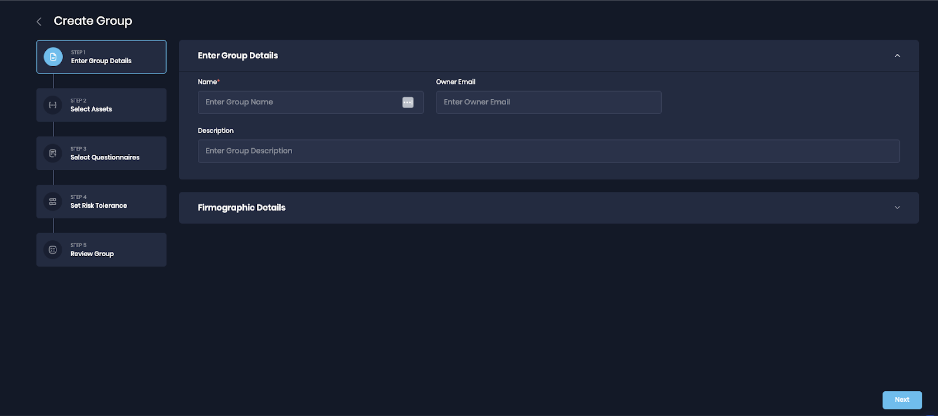
6. Model risk scenarios for business units or application groups
To provide a more comprehensive business context from a risk perspective, we have introduced the concept of building Groups. This release empowers our users to define groups based on their business requirements. A Group can reflect any entity such as a business unit, a division, a department, a data center, or an application. Business context and control assessment attached to the Group is then used to model risk scenarios on top of it.
Here's what you can expect,
Wizard-Based Group Creation: Create groups with ease through our intuitive, 4-step wizard. This streamlined workflow simplifies the process and ensures we capture all necessary information for risk estimation.
Group Metadata: When creating a group, you define group details that include, Name, Description, Firmographic Details (Industry, country, revenue, employee count, Internet-facing), Group Type (Smart, Static, or No Asset groups), and select the applicable Questionnaire. Firmographic data for groups are a snapshot of the enterprise group and can easily be modified.
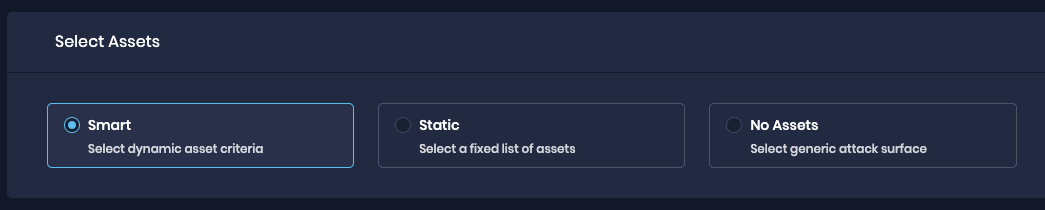
Group Types: There are 3 distinct approaches for creating a group, each tailored to different needs. These group types enable you to seamlessly connect technology assets or people with the appropriate groups.
Smart Group: A group that the platform continuously updates by automatically associating technology assets and/or people based on specific filters you define, simplifying the grouping process and ensuring automatic updates.
Static Group: You manually specify the exact technology assets and/or people by applying filters.
No Assets Group: The No Asset Group proves beneficial when you lack information about assets for inclusion in a group but intend to model a Risk scenario. This group type enables you to select the Attack Surface Type from predefined options like Applications, Cloud, End-points, SaaS, etc. Users can later convert this group into Smart Groups once they activate integrations or receive assets with smart tags, allowing them to create more advanced and dynamic Smart Groups.
Questionnaire Association at Group Level: The Financial Impact Questionnaire is used to calibrate drivers for loss magnitude calculation. NIST CSF Questionnaire assessment can aid in conducting the security control assessment.
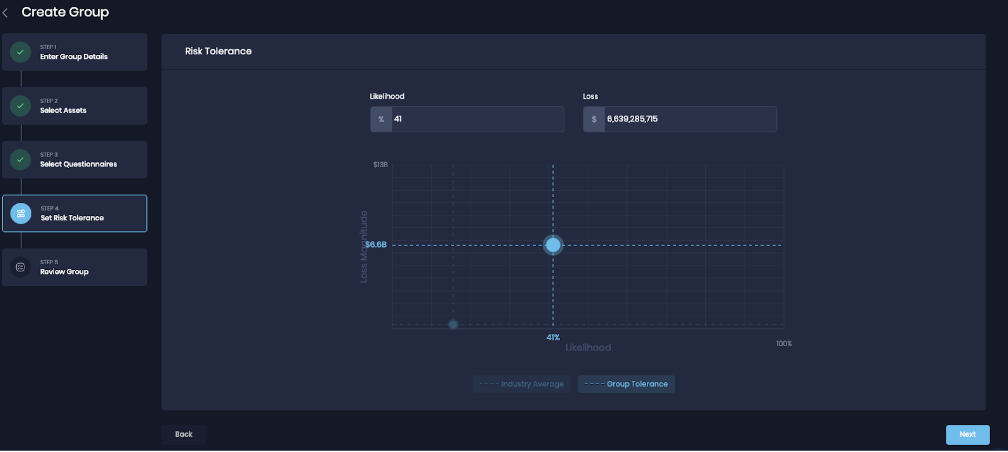
Risk Threshold Definition: You may define the risk threshold in terms of likelihood and loss magnitude when creating a group. These values will be applied to all associated risk scenarios created for this group. This threshold will give an easy indication of risks that are crossing the threshold on the group's overview page.
Review and Create Group.


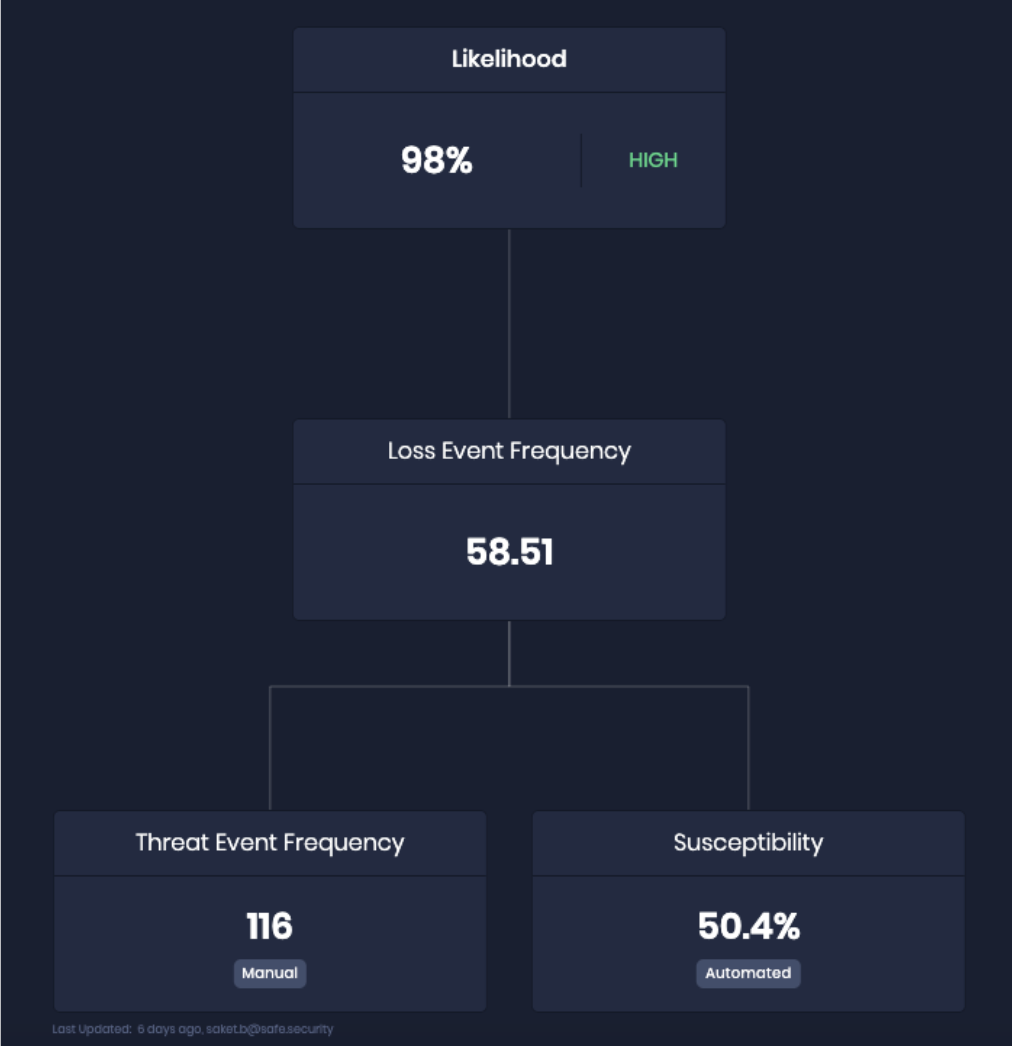
7. Understanding and Tuning Likelihood Factors
The Likelihood factor improves transparency and understanding in risk assessments. It provides a visualized representation of outputs based on FAIR methodology. Users can further drill down to understand and explore what comprises the likelihood estimation.
Key Highlights
Manual Override and Tunability: The Likelihood Factor can be manually overridden, giving users greater control and flexibility in managing risk factors.
CustomThreatEventFrequency(TEF): In case data is available about threat events from any other tools in the organization
Custom Susceptibility: in case the modeling exercise is already done offline
Rationale Capture: To ensure transparency and accountability in the risk assessment process, each manual change captures a mandatory rationale behind updating the value
Visualize Outputs: Users can now visualize and interpret model outputs using the FAIR methodology.
8. Understanding and Tuning Loss Factors
This view provides users with a better understanding of loss factors in risk assessments. It visualizes the breakdown of losses based on the FAIR-MAM methodology, making decision-making more informed about the magnitude of potential losses.
Key Features
Manual Override and Tunability of Loss Drivers: This allows users to manually override and tune the Loss Driver value for Primary Loss and Secondary Risk, giving users greater control and flexibility in managing loss factors.
Explicit Assumptions: All loss driver assumptions are now prominently displayed to provide users with complete transparency.
Visualize Outputs: Our system will allow users to visualize and interpret model outputs using the FAIR-MAM methodology.
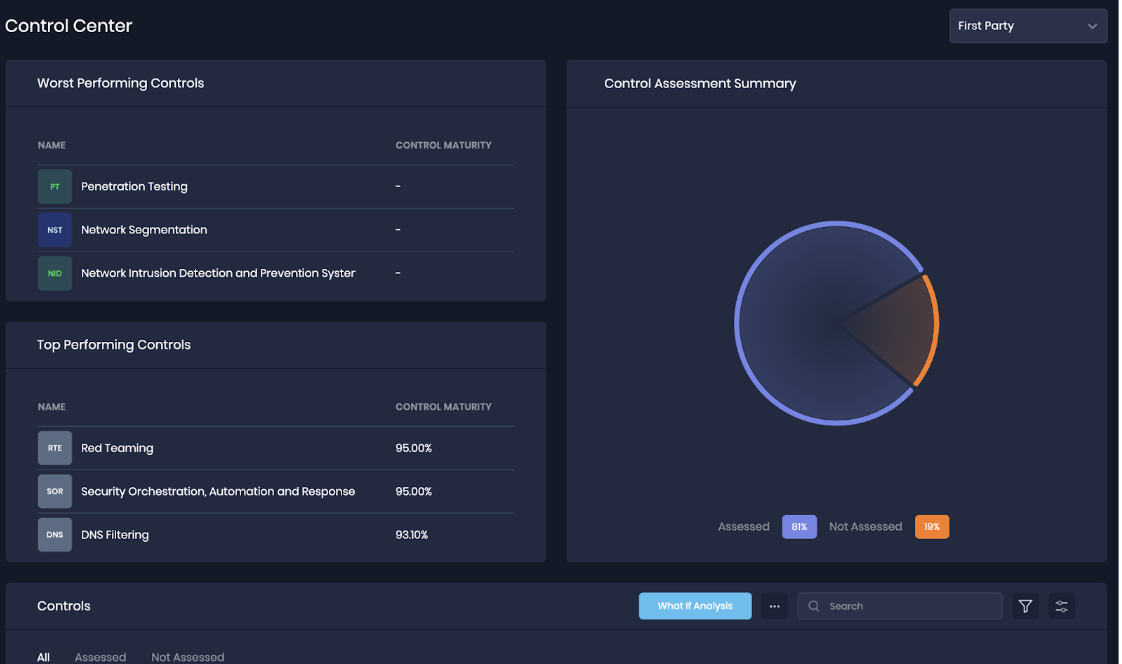
9. Control Center
The Control Center stands as a pivotal element within our cybersecurity strategy, showcasing the cutting-edge SAFE Cyber Security Controls Framework rooted in the FAIR-CAM methodology. This comprehensive framework comprises over 50 Intricately developed controls meticulously tailored to fortify your organization's cyber security defenses and resilience.
Key Highlights
Control Center: The Control center allows you to manage, assess, and monitor controls easily. It provides real-time visibility into the organization's cyber posture, acting as a collaborative space to track progress and address findings.
Control Maturity: Control maturity indicates the level of capability, coverage, and reliability of cybersecurity controls within an organization. The maturity of controls is typically assessed in various dimensions, including:
Capability: This aspect evaluates the efficiency of implementing each control. It is often classified into maturity levels such as M0 (Not Implemented), M1 (Foundation), M2 (Advance), and M3 (Expert). A higher maturity level indicates a more advanced and proactive approach to control implementation.
Coverage: Coverage refers to the extent to which each control is implemented across the organization. It is measured as a percentage and classified into maturity levels, such as M0 (Not Implemented), M1 (Basic Coverage), M2 (Advance Coverage), and M3 (Comprehensive Coverage). Higher coverage maturity implies a more thorough implementation of controls across the digital landscape.
Reliability: Reliability assesses how systematically and regularly the effectiveness of controls is validated. It is categorized into maturity levels, with M0 (Not Implemented) indicating no regular assessment and M1, M2, and M3 representing increasing levels of reliability maturity. Higher reliability maturity ensures that security measures remain robust and effective over time.

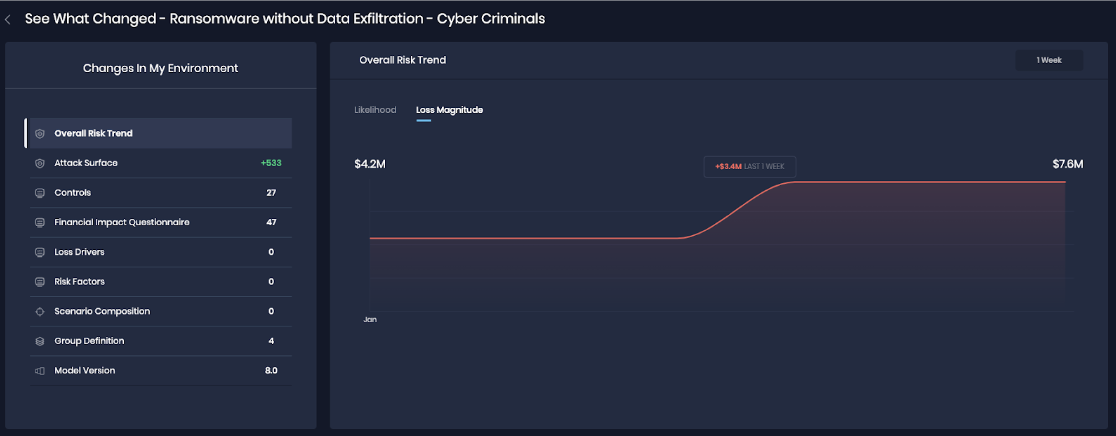
10. See What Changed
See What Changed allows you to understand what caused the Loss Magnitude and Likelihood changes. You will be able to effortlessly view the change history for a selected time interval.
Change History: The system allows you to select a time interval and get a comprehensive view of the changes that occurred within that duration in a graphical view.
Environmental Shifts Display: The system provides detailed insights into changes in various environments including changes in the number of Attack Surfaces, Controls, Risk Scenario compositions, Group composition, and model versions.

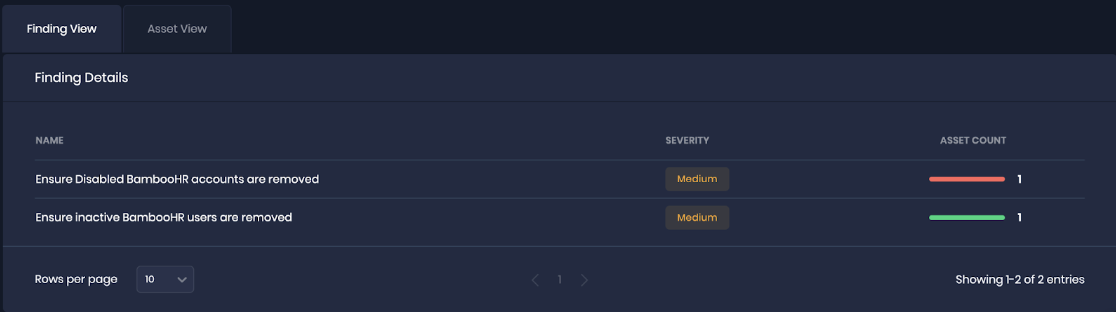
11. Asset and Finding view on the Integrations page
Following the successful configuration of an integration, SAFE pulls Asset and Finding information, and now provides a user-friendly experience for reviewing ingested data with the Finding and Asset view.
Key Features
Finding View
The Finding View tab offers a comprehensive overview of all findings retrieved from the integration.
Each finding is presented with essential details such as finding name, severity, and asset count.
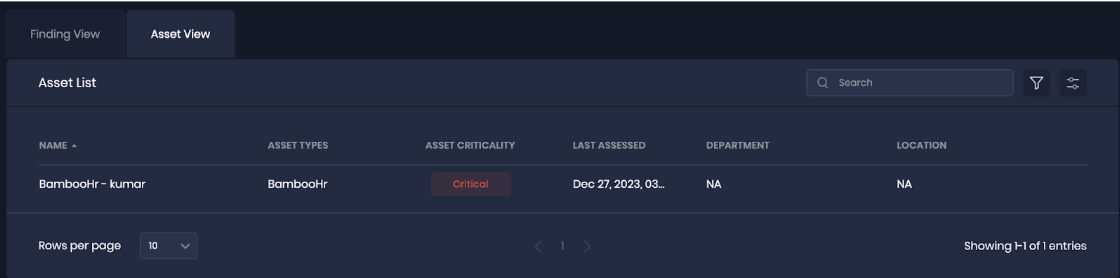
Asset View
Easily access and review all assets fetched from the integration through the dedicated Asset View tab.
12. Identify Top Risky Controls and their ROI
We are introducing the ability to identify Top Risky Controls and their Return on Investment (ROI). This feature empowers users to pinpoint the most critical controls associated with each Risk Scenario and understand the potential reduction in likelihood by addressing these controls. This strategic functionality offers a data-driven approach to risk management, providing users with valuable insights into prioritizing remediations.
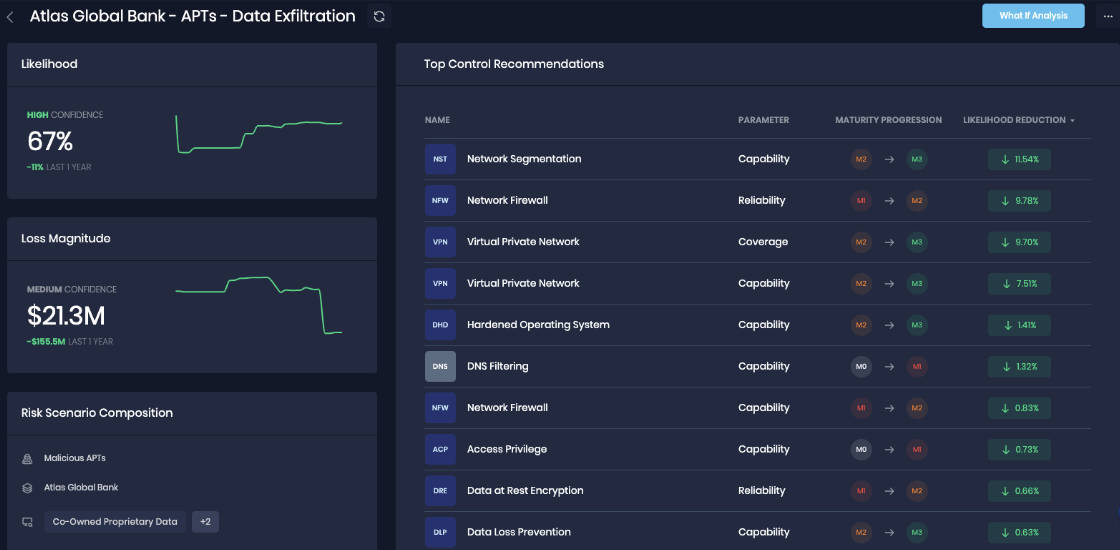
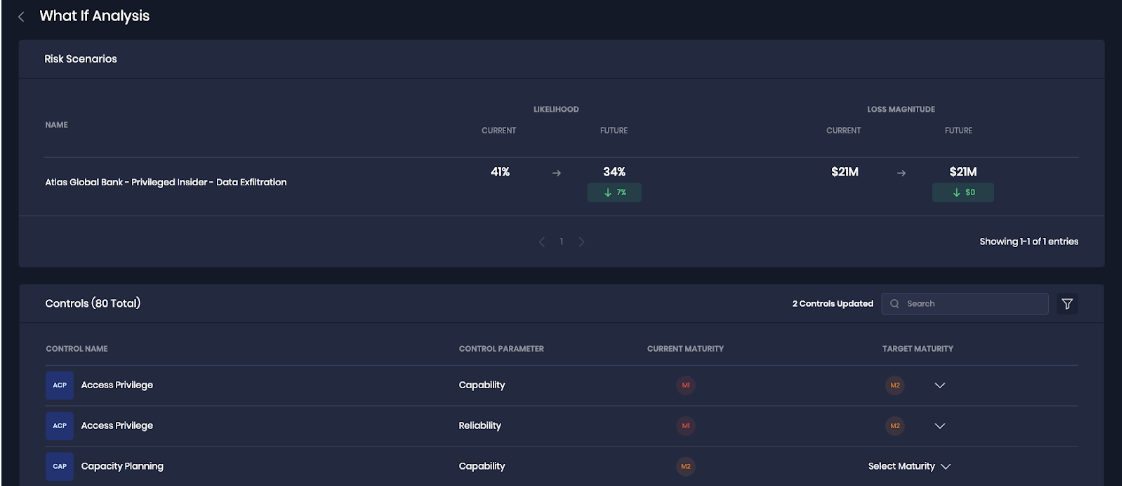
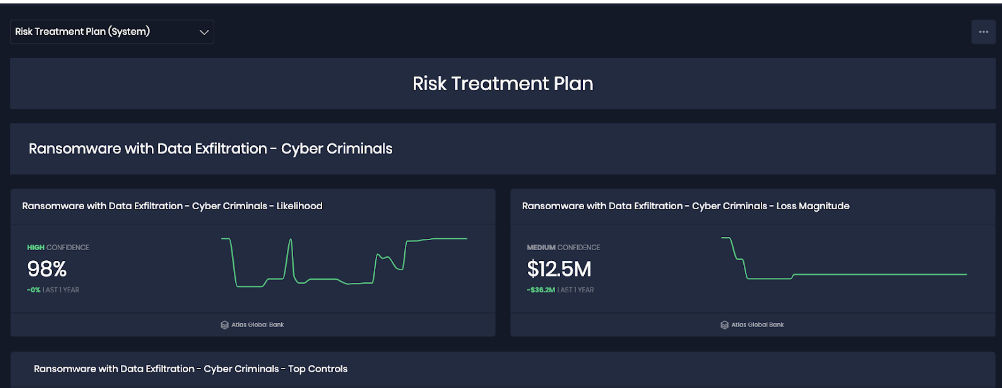
13. Build Risk Treatment plans (What If Analysis)
The What If Analysis feature is a powerful addition to SAFE that allows you to simulate changes to one or more Actionable Insights. With this feature, you can visualize how your decisions impact your Loss Magnitude and Likelihood, helping you make more informed choices and formulate precise risk treatment plans.
Annualized loss, Loss Magnitude and likelihood Simulation: SAFE will be equipped with a simulation feature, allowing you to input actionable insights and review potential changes in Annualized loss, Loss magnitude and Likelihood.
Comparative Analysis: Explore the outcomes of different plans, gaining a deeper understanding of the potential consequences of various combinations of Actionable Insights.
Efficient Plan Creation: You can now create plans based on labels, simplifying the organization and management of your simulations.
Streamlined Data Management: With the introduction of the ability to group and filter Actionable Insights, you can focus on the data that's most relevant to your objectives.
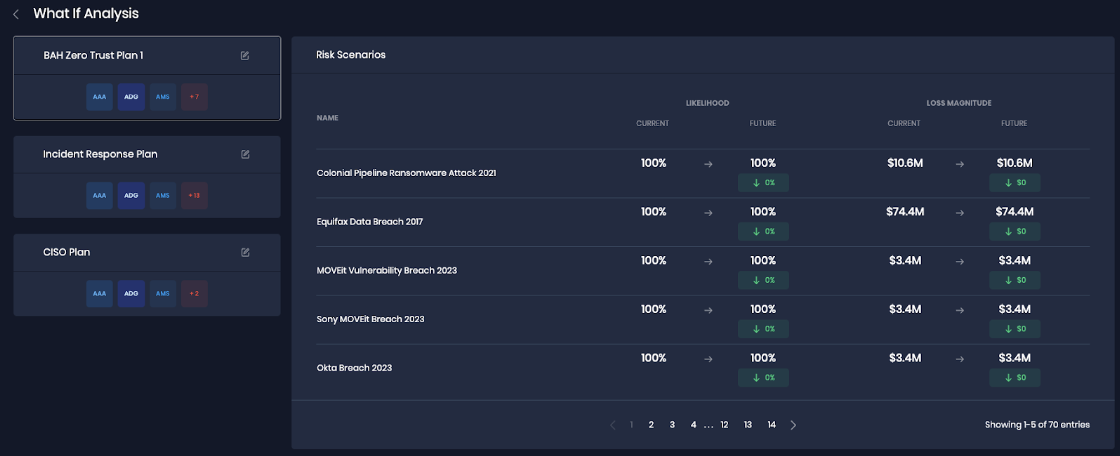
Risk Scenario Level: Each Risk Scenario has associated control recommendations populated to reduce risk. Now you can simulate the aggregated impact of fixing multiple control recommendations for the risk scenario.


14. Introducing Customizable Dashboard
In this release, we are introducing Customizable Dashboards in SAFE. This exciting addition empowers users to tailor their own dashboards within the SAFE platform to suit their unique needs.
The SAFE dashboard includes a range of widgets that users can select from to create their ideal dashboard:
.png)
Out of the Box Dashboards
CISO Dashboard
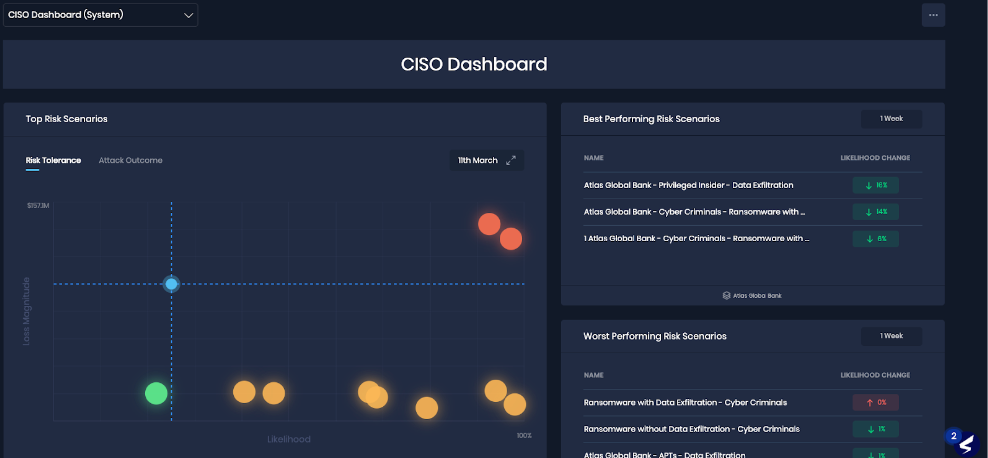
CFO Dashboard
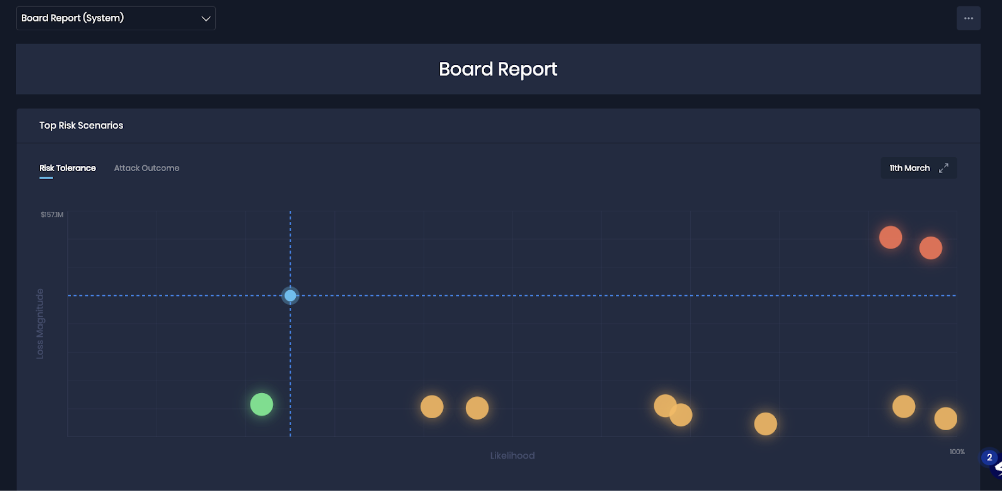
Board Report
Risk Treatment
Switch to Other Dashboards: Easily switch between predefined dashboards to explore different data perspectives.
Set Default Dashboard: Personalize your experience by designating your starred dashboard as the default view.
Create Custom Dashboards: Craft a unique dashboard tailored to your requirements by selecting widgets from the widget library.
Private Dashboards: Any custom dashboards you create are exclusively available to you, ensuring privacy and a user-centric experience.
Widget Rearrangement: Customize the layout of your custom dashboard by rearranging widgets to align with your priorities.
Dashboard Template: Create a Dashboard by selecting a pre-configured template with a few clicks.
Dashboard Download: Quickly Export and Share the dashboards for effective communication


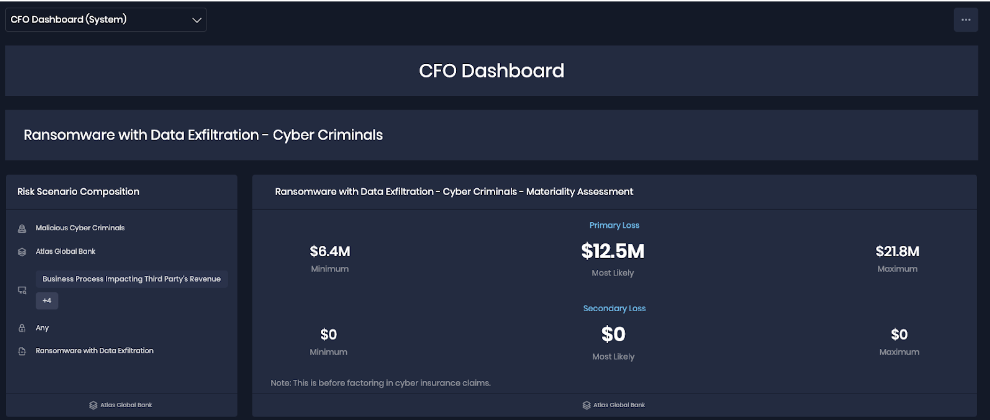
15. SEC Materiality Reporting
We are introducing the Materiality Dashboard in this release, a dynamic feature within SAFE designed to enhance your risk management capabilities. The Materiality Dashboard empowers you to visually explore the estimated distribution and breakdown of materiality for a specific risk associated with a material asset.
Key Features
Comprehensive Visualization: The Materiality Dashboard offers a holistic overview, presenting both primary and secondary quantitative costs. Gain insights into the primary and secondary costs based on the breakdown of loss drivers, allowing for a more nuanced understanding of potential impacts.
Effective Communication: Use the dashboard to effectively communicate projected losses to internal and external stakeholders. The visualization tools enhance the clarity of information, facilitating transparent discussions about risk exposure and mitigation strategies.
Streamlined Reporting: With the Materiality Dashboard, you now can generate materiality reports that align/are compatible with SEC standards on the fly. This functionality simplifies the reporting process, enabling you to quickly compile and share essential information with regulatory bodies.
.png)
.png)
16. New SAFE Sign-Up & Sign-In Experience
Our new Sign-up flow has been designed to provide a seamless and user-friendly experience, ensuring that accessing SAFE is easier and more secure than ever before.
Key Enhancements
SSO Enabled Sign-In: SAFE supports the Single Sign-On (SSO) Sign-In method. Experience the convenience of one-click access.
Invite Users to SAFE: We've made user onboarding a breeze. Invite users to join SAFE via email invitations. They can quickly verify themselves and complete the sign-up process with just a few clicks.
Two-Factor Authentication (2FA): You can also enable Two-Factor Authentication for all native SAFE users. SAFE Admins can also reset 2FA for users in SAFE.
17. Role-Based Access Control (RBAC)
We are introducing Role-Based Access Control (RBAC) in SAFE, offering you greater control and customization over user permissions.
Key Features
Custom Roles
Create roles to align with your organization's unique structure and requirements.
Grant read and/or write permissions to specific groups, providing a fine-tuned access experience.
Role Management
Explore the newly added "Role Management" option under Settings for a seamless experience in creating and managing custom roles.
18. Global Search
Now, navigating through SAFE is even more intuitive with the introduction of the Global Search feature. This functionality empowers users to search for Assets, People, Risk Scenarios, and Groups effortlessly using relevant keywords.
.png "Screenshot 2024-04-02 at 11.02.57 AM(1).png")
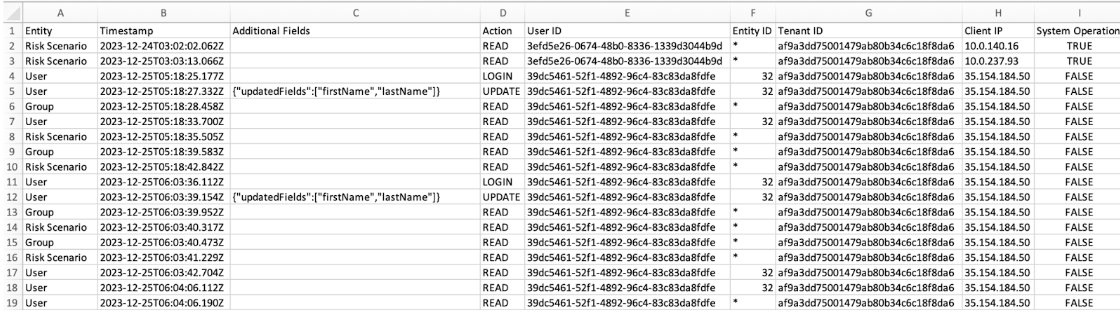
19. Audit Logs
We are introducing the Audit Log feature in SAFE. This feature empowers SAFE Admins to export logs in CSV format for a specified timeframe, offering a comprehensive overview of user activities.
Key Highlights
Export Logs in CSV: Users can now export logs in CSV format, providing a convenient and accessible way to review and analyze user activities within SAFE.
LogContent: The log CSV includes the User ID, timestamped user activity, and activity area in the product to provide a chronological record of activities and interactions performed by users.
IP Address Tracking: It also tracks the Client's IP address.

Note: Current SAFE supports audit logs for Users, Groups, and Risk Scenarios.
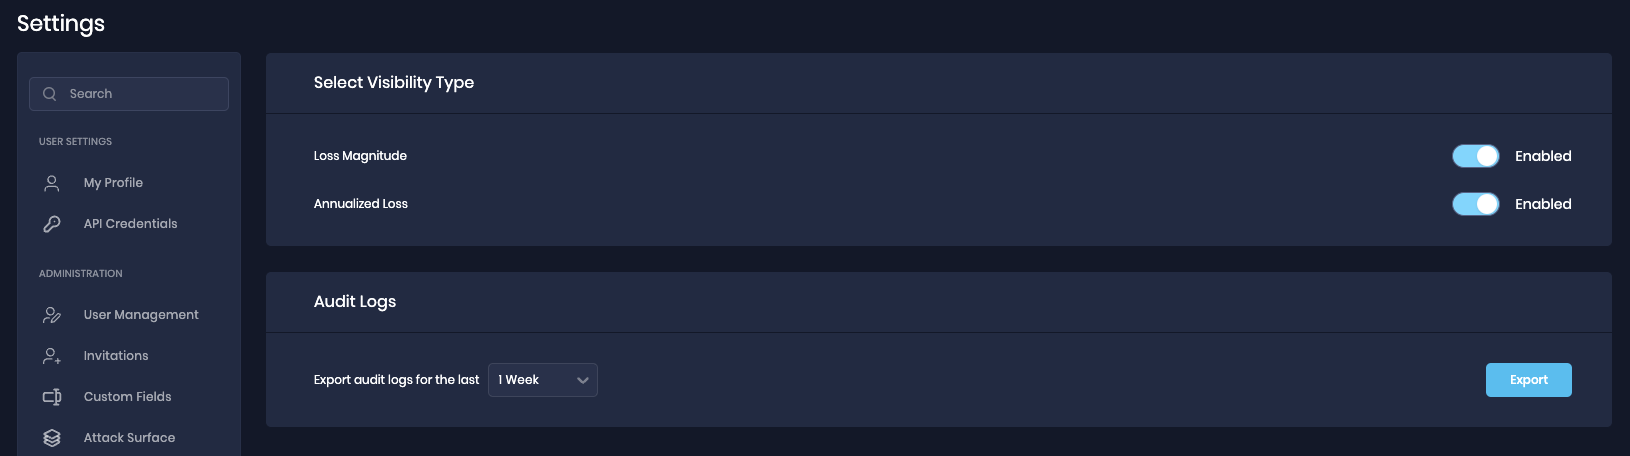
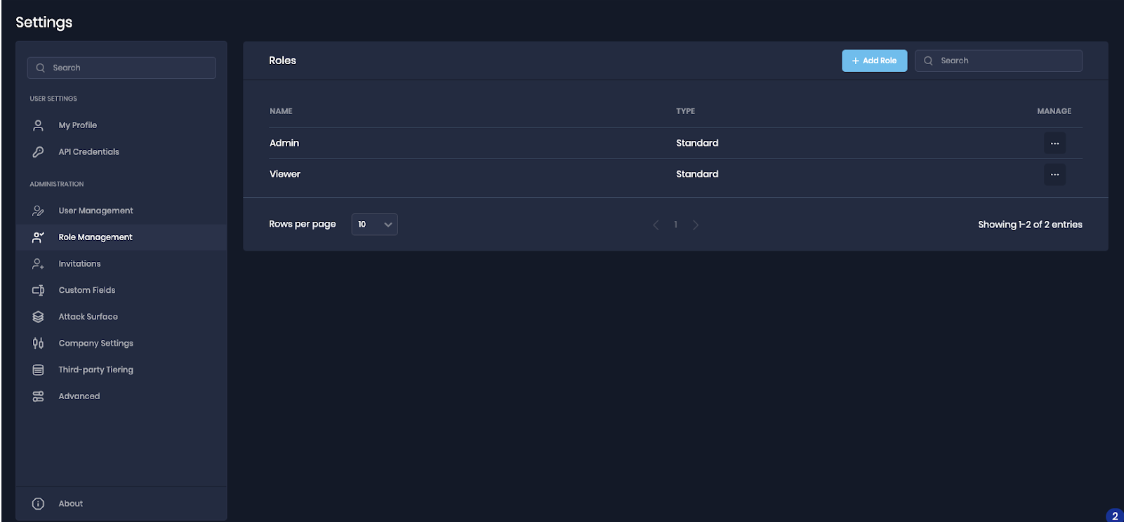
20. New Settings Page
We're introducing a comprehensive Administrative Settings Console in SAFE, which empowers you with greater control and customization options.
User Profile Management: Update and personalize your user profile information, ensuring your identity is accurately reflected within the system.
API Credentials: Easily manage your API credentials, granting you secure access to SAFE's functionalities and data.
User Management: Efficiently manage user accounts, and invite new users to SAFE.
Custom Fields: Define and configure custom fields to tailor SAFE to your specific needs and data requirements.
Role Management: Allows you to add and manage custom roles in SAFE.
Attack Surface
Asset Offboarding: Define and configure the number of days for asset inactivity to offboard it from SAFE.
Default Parameter Settings: Set and adjust default parameters (Business Criticality, Department, and Location) to ensure that SAFE operates per your preferences.
Company Settings: This setting allows you to upload the company logo.
Advanced Settings: This allows you to enable or disable Loss Magnitude, and Annualized Loss in SAFE.
Was this article helpful?