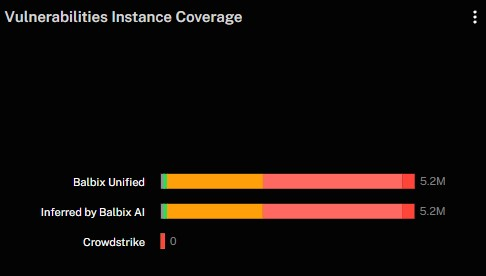
The Vulnerabilities Instance Coverage widget shows the total number of vulnerability instances detected in your environment, categorized by data source. Each bar represents a distinct source—such as native integrations, inferred data, or third-party tools—and is segmented by severity. This helps you evaluate how much each source contributes to your overall vulnerability visibility and where gaps might exist.
You can use this widget to assess the completeness of your detection strategy. If some sources are contributing significantly while others show limited or no findings, it may indicate underutilized tooling, integration issues, or limited visibility in specific parts of your infrastructure. Reviewing this distribution helps ensure that all relevant sources—automated scans, inferred intelligence, endpoint agents, etc.—are active and providing value.
This widget also supports validation and tuning of your data pipeline. By comparing the volume and severity of findings from different sources, you can identify where enrichment from AI or consolidation engines is enhancing detection and where additional integration work may be required. It allows you to close visibility gaps and optimize your vulnerability management process by ensuring that all relevant tools are contributing to a unified, accurate risk picture.
See Also: