Overview
The Exposure Analysis tool designed to quantify and manage cybersecurity risks.
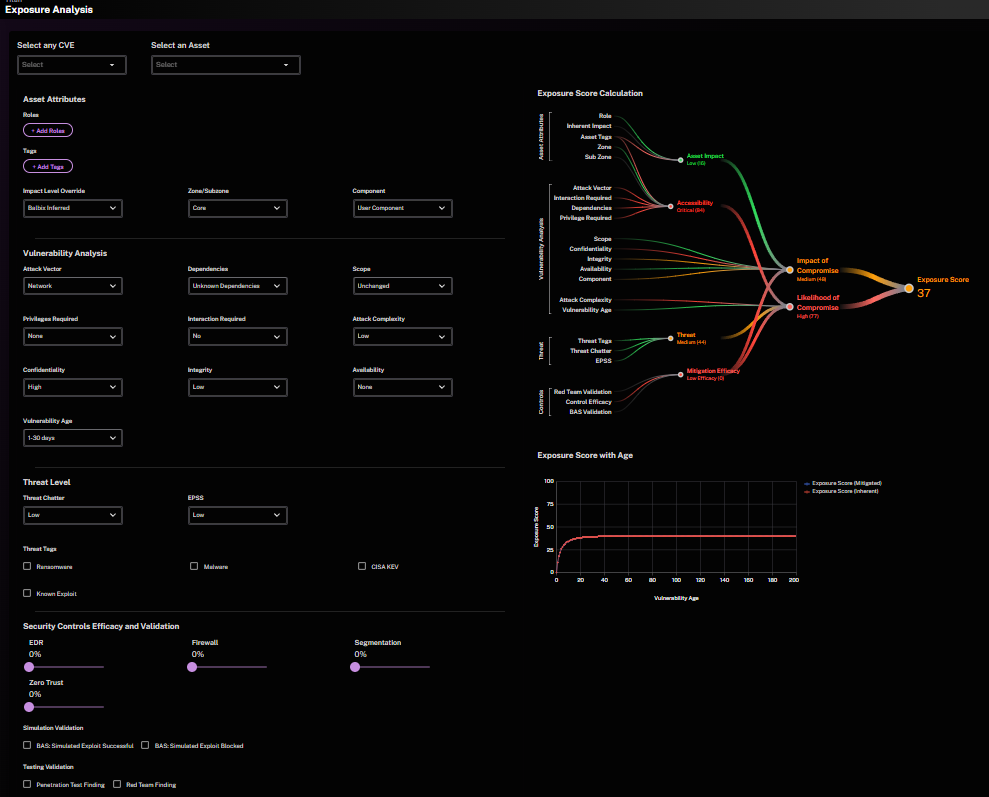
By assigning exposure scores ranging from 0 to 100, organizations can identify, prioritize, and address vulnerabilities effectively. The tool combines technical analysis with business impact assessment to guide decision-making and enhance risk mitigation strategies.
Business Context
Key Benefits
Organizations use the Exposure Score Analysis tool to:
Focus Resources Efficiently: Concentrate efforts on critical vulnerabilities that pose the highest risk.
Demonstrate Security Improvements: Provide quantitative evidence of risk reduction.
Enhance Compliance Posture: Address vulnerabilities in line with regulatory standards.
Strengthen Decision-Making: Use actionable insights to allocate security budgets effectively.
Strategic Use Cases
Proactive Risk Management: Continuously assess and prioritize risks based on their potential impact.
Incident Preparedness: Understand residual risks and develop contingency plans.
Regulatory Reporting: Demonstrate adherence to standards using detailed exposure scores.
Investment Rationale: Justify cybersecurity investments through measurable risk metrics.
Exposure Score Framework
Understanding Exposure Scores
The tool evaluates risk using a scoring model that incorporates technical and business factors:
Score Range | Category | Description |
0-29 | Low | Minor risks requiring monitoring. |
30-59 | Medium | Moderate risks requiring standard remediation. |
60-79 | High | Significant risks demanding prompt attention. |
80-100 | Critical | Severe risks requiring immediate action. |
The categorization of scores simplifies the prioritization process. A "Critical" score indicates severe vulnerabilities that could result in significant operational or reputational damage, whereas "Low" scores reflect minor risks that can be monitored without immediate intervention.
Risk Scoring Components
The exposure score is determined by analyzing five key dimensions:
1. Vulnerability Attributes
Attribute | Options | Impact on Score |
Attack Vector | Network, Adjacent, Local | Higher score for more remote vectors. |
Attack Complexity | Low, High | Higher score for lower complexity. |
Privileges Required | None, Low, High | Higher score for lower privileges. |
User Interaction | None, Required | Higher score for no interaction. |
Scope | Changed, Unchanged | Higher score for scope change. |
CIA Impact | Low, Medium, High | Higher score for greater confidentiality, integrity, or availability impacts. |
Dependencies Required | Unknown Dependencies, Dependencies Met, Dependencies Unmet | assessment of whether dependencies are required (privileges and user-interaction are a subset of these) and to what extent they are likely met |
These attributes are integral to assessing how easily a vulnerability can be exploited and the potential impact. For example, vulnerabilities requiring no user interaction ("None") and targeting remote vectors are inherently riskier, as they expand the attacker’s capabilities.
2. Threat Landscape
Factor | Description | Impact on Score |
EPSS Score | Exploit probability | Direct influence on urgency. |
Known Exploitation | Active exploitation in wild | Significant score increase. |
CISA KEV | Known Exploited Vulnerabilities list | Major score increase. |
Malware/Ransomware | Associated active campaigns | Substantial increase. |
Dark Web Activity | Observed criminal interest | Score multiplication. |
Exploit Availability | Published code or techniques | Notable increase. |
The threat landscape reflects real-world conditions affecting the likelihood of exploitation. For instance, active ransomware campaigns or exploit availability on public platforms dramatically heighten urgency, requiring immediate mitigation.
3. Security Controls
Control Type | Consideration | Impact on Score |
EDR/XDR/EPP | Endpoint protection | Reduces score by mitigating endpoint risk. |
Firewalls | Network protection presence | Decreases exposure through access limitations. |
Segmentation | Network isolation level | Reduces exposure by limiting accessibility. |
Zero Trust | Access control implementation | Significantly reduces exposure. |
Local Controls | Host-based protection | Additional score reduction. |
Security controls mitigate vulnerabilities by limiting their exploitability. For example, implementing Zero Trust architecture significantly reduces exposure by enforcing strict access controls and ensuring that even internal users or systems are verified.
4. Asset Impact
Factor | Consideration | Impact on Score |
Business Criticality | High/Medium/Low | Core multiplier for risk significance. |
Mission Criticality | Essential/Supporting/Optional | Amplifies overall risk based on importance. |
Asset Role | DC/DB/Exchange/Web/etc. | Adjusts scores based on asset functionality. |
Environment | Production/Dev/Test/Stage | Higher scores for production systems. |
Operating Status | Active/Decommissioned/Suspended | Active systems receive higher exposure. |
The role and criticality of an asset determine its overall impact score. A production database containing customer data, for instance, will have a significantly higher score than a decommissioned test server. Based on the role played by the asset on the network, it may be more prone to C, I, A compromises or some combination thereof.
5. Asset Location
Zone | Characteristics | Impact on Score |
External Facing | Direct internet exposure | Highest exposure. |
DMZ | Controlled external access | High exposure. |
Perimeter | Border systems | Elevated exposure. |
Core | Internal systems | Moderate exposure. |
AirGapped | Isolated systems | Lowest exposure. |
The closer an asset is to external networks, the higher its exposure score. For example, systems in the DMZ are inherently more vulnerable than those isolated in an air-gapped network.
Mitigation Scenarios
The tool models the effect of different mitigation strategies on exposure scores:
Fully Mitigated:
Example: An advanced firewall and intrusion detection system prevent exploitation entirely.
Result: Risk is neutralized; exposure score approaches 0.
Partially Mitigated:
Example: Network segmentation limits access, but some vulnerabilities remain exploitable.
Result: Reduced exposure score, but residual risk persists.
High Exploitation Potential:
Example: A critical vulnerability that is tagged as CISA KEV on an external facing business critical asset.
Result: High exposure score requiring immediate response.
Technical and Mathematical Insights
Score Levels and Implications
The tool calculates exposure scores by blending likelihood and impact:
E = L × I
Component | Description | Impact on Score |
Likelihood (L) | Probability of exploitation | Higher likelihood raises the score. |
Impact (I) | Business impact of exploitation | Greater impact amplifies the score. |
This formula quantifies risk by combining the probability of compromise (likelihood) with the severity of consequences (impact). For example, a highly accessible system with a significant business impact results in a critical exposure score.
Likelihood and Impact Calculation
Likelihood of Compromise
L = A × T × (1 - M)
Factor | Description | Example |
Accessibility (A) | Ease of access to the asset | Air-gapped systems have low accessibility. |
Threat (T) | Probability of targeting | Public exploits increase the threat level. |
Mitigation (M) | Control effectiveness | Fully patched systems achieve high mitigation. |
This shows that reducing accessibility (A) and increasing mitigation (M) directly lower the likelihood of compromise.
Note: This is the likelihood of exploitation provided there is knowledge of exposure and the attempt to exploit is made, and not a time-bound estimate of likelihood.
Impact of Compromise
Impact reflects the business consequences of an exploited vulnerability. Key considerations:
Operational Dependency: Systems critical to operations score higher.
Data Sensitivity: Assets holding sensitive data contribute to higher scores.
Financial Exposure: Vulnerabilities leading to monetary loss result in elevated scores.
Compliance Requirements: Vulnerabilities leading to compliance failures such as HIIPAA, PCI, GDPR etc.
Mitigation Efficacies
Mitigation efficacy measures the effectiveness of applied controls:
Metric | Formula | Example |
Technique Efficacy | Passed Controls / Total Controls | If 8/10 controls pass, efficacy = 80%. |
Unmapped Efficacy | Σ (Proportion × Source Efficacy) | Weighted aggregation for unmapped techniques. |
By quantifying control efficacy, this metric helps identify weak points in mitigation strategies, enabling targeted improvements.
Workflow
The Exposure Score Analysis tool is highly responsive, recalculating and adjusting the exposure scores dynamically with every parameter change. This ensures real-time feedback for security teams to evaluate and refine their strategies effectively.
Choose a Vulnerability: Select a vulnerability from the drop-down menu, which includes all published CVEs and is updated hourly to reflect newly discovered vulnerabilities.

For scenarios requiring custom parameters, users can modify the vulnerability details directly in the "Vulnerability" section to simulate hypothetical vulnerabilities or internal findings without an assigned CVE number.

Select an Asset: Identify the asset to simulate the vulnerability. This action preloads asset-specific attributes such as tags, roles, zones of operation, business and mission criticality, and other key characteristics. Users can further refine these parameters after selection.

Alternatively, users can bypass asset selection and manually configure the asset attributes to suit unique simulation needs.

Update Threat Levels: The tool integrates real-time threat intelligence from Balbix, updating threat levels hourly. When a CVE is selected, associated threat details (e.g., exploit availability, active exploitation status) are automatically populated. Users can adjust these levels manually to explore different threat scenarios.

Adjust Security Controls: Configure the effectiveness of various security controls, including Firewalls, EDR/XDR/EPP solutions, network segmentation, and Zero Trust implementations. These adjustments allow for precise simulation of control efficacy and their impact on exposure scores.

Include Simulation Validation: Input findings from Breach Attack Simulation (BAS) tools under the "Simulation Validation" section. Similarly, incorporate data from Red Team exercises or penetration tests in the "Testing Validation" section. These validations enhance the accuracy of simulations by aligning them with real-world testing data.

Visual Insights
Exposure Score Calculation (Sankey Diagram): A dynamic Sankey diagram visually represents the flow of inputs, mathematical combinations, intermediate outputs, and the final exposure score. Each segment of the diagram is color-coded based on the associated risk level, helping users quickly identify critical factors contributing to the score.

Exposure Score with Age (Graph): This graph illustrates the evolution of an exposure score over time. The red line indicates the inherent exposure score before considering mitigation measures, while the blue line reflects the residual score after applying security controls. This provides a clear visualization of how security measures reduce risk over time and highlights areas needing further improvement.
