Overview
This guide will show you how to perform the following steps to successfully set up the Balbix Traffic Analyzer:
Create a Deployment Plan
Set Up your Switch
Connect Network Cables and Power
Configure the Appliance
Remote Management
Verify Connectivity
Balbix Traffic Analyzer (TA) is a physical or virtual security appliance that dynamically inspects and evaluates network traffic the instant traffic traverses through network switch connected to TA appliance — TA observes all traffic originating from managed and unmanaged assets in the network. It determines the user, owner, operating system, device configuration, software, services, patch state and the presence of security agents. TA provides continuous monitoring of these devices as they come in and go out of the network.
Note: This guide describes the installation for a single stand-alone TA Appliance.
For more detailed information or information about deploying multiple Appliances for enterprise-wide network protection, refer to the TA Installation Guide and Console User Manual. These documents are located on the TA CD in the /docs directory.
Included in your Traffic Analyzer Package
Traffic Analyzer Appliance
Quick Installation Guide
Warranty document
Mounting brackets
Power Cables
Deployment Plan
Before performing the installation, you should decide where to deploy the Appliance and learn about Appliance interface connections.
Decide Where to Deploy the Appliance
Selecting the correct network location for the Appliance is crucial for successful deployment and optimal traffic coverage of the TA. The correct location will depend on your desired implementation goals and network access policies. The TA should be able to monitor traffic that is relevant to the desired policy. For example, if your policy depends on monitoring authorization events from endpoints to corporate authentication servers, the TA will need to be installed in datacenter with span ports from core or distribution switches so that it captures DHCP traffic along with endpoints traffic flowing into authentication server(s).
Deployment Scenarios
Flat network with SUBNETs for broadcast domain restriction
Flat network with SUBNETs defined by VLANs for broadcast domain restriction
These types of network are combination of multiple flat networks or segments of network created for containing the broadcast messages. These networks might have groups based on functionality like LAN, DMZ etc. which are connected through layer 3 devices for communication. SPAN port from the distribution switches provide the ability to monitor the traffic between segments. E.g. Monitor the traffic between User Segment and the Server Segment Network discovery module interface obtains an IP address/connectivity from the server segment for asset discovery across segments.
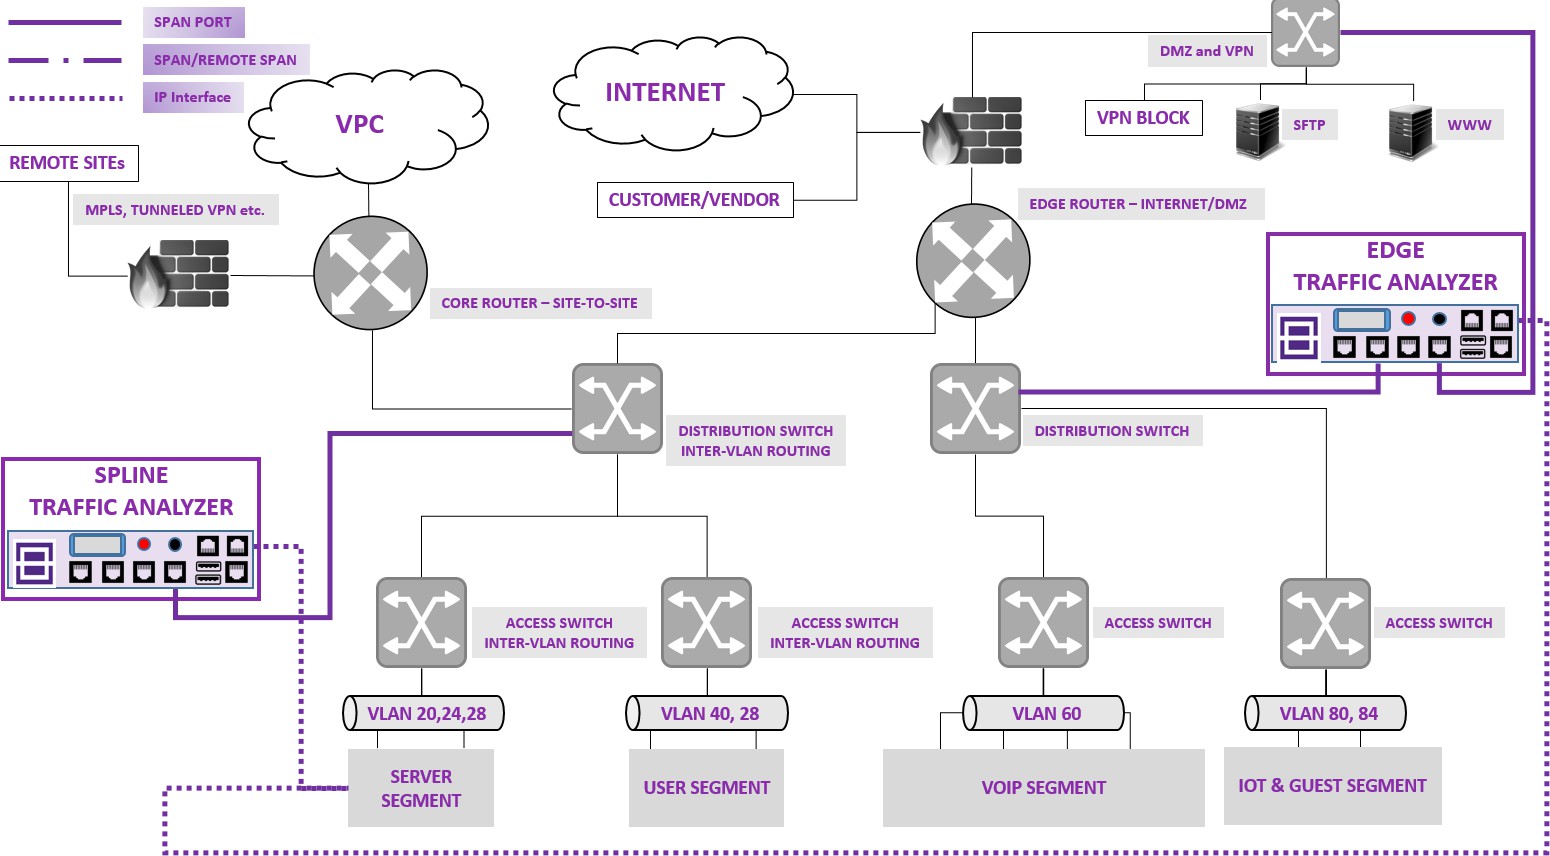
Note: For Traffic analysis span port from layer 2/3 switch needs to be connected to Balbix appliance data port interface 01 or 03 (As Data port 02 and 04 are mirror for 01 and 03 respectively).
Segmented network with SUBNETs defined by VLANs for restricting access with—Privileged VLAN that has unrestricted routing to all other VLANs
A privileged VLAN provides connectivity to most of the network for the purposes of Balbix appliance management and network monitoring. The Network Discovery Module interface obtains an IP address from the privileged Subnet which facilitates the discovery and analysis of all other VLANs/Subnets.
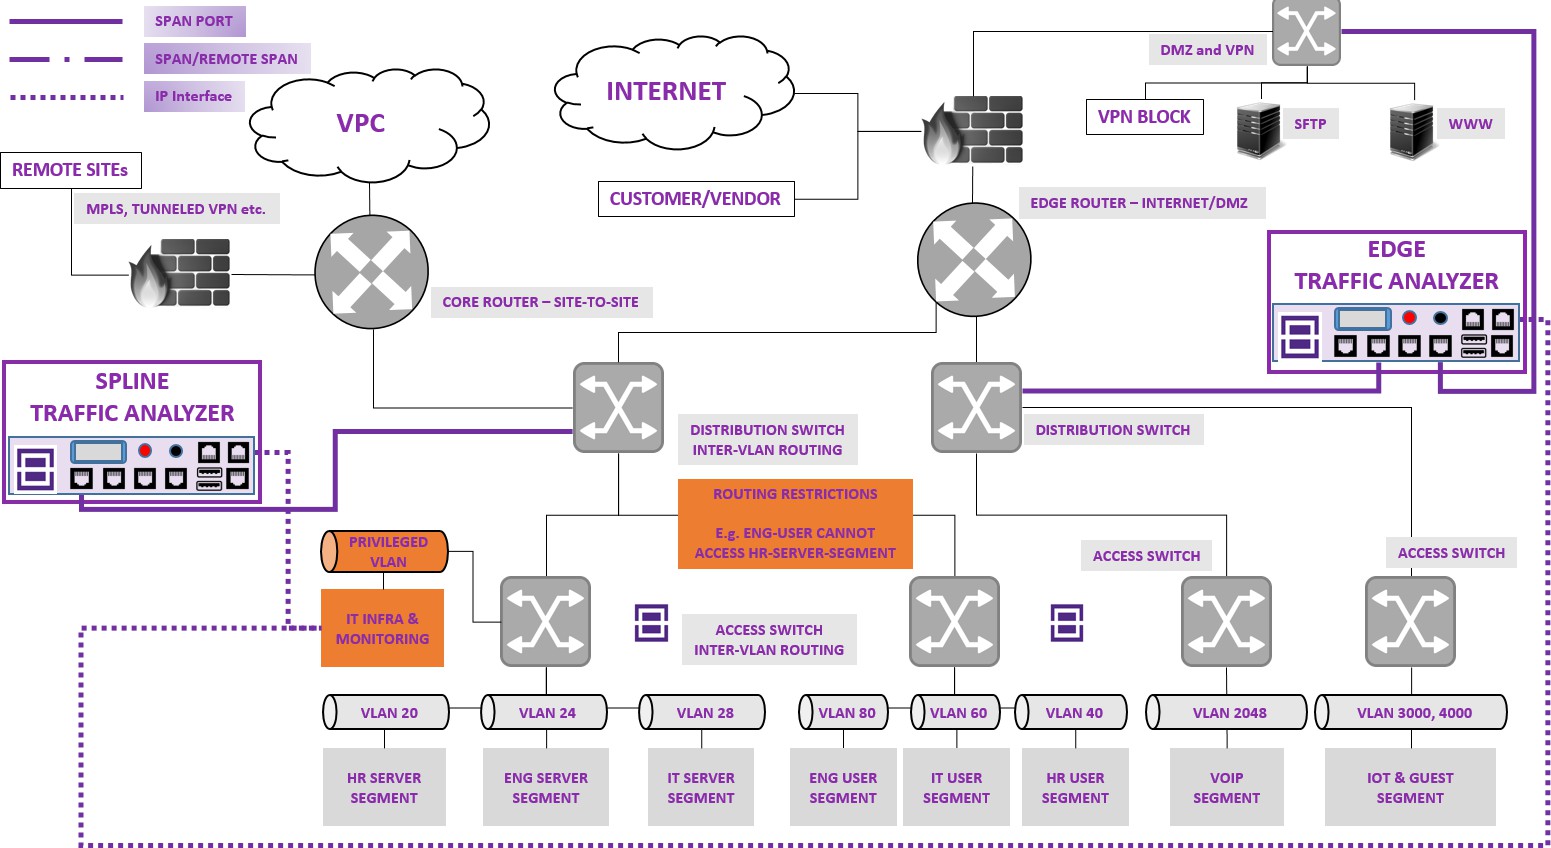
Note: For Traffic analysis span port from layer 2/3 switch needs to be connected to Balbix appliance data port interface 01 or 03 (As Data port 02 and 04 are mirror for 01 and 03 respectively).
Segmented network with SUBNETs defined by VLANs for restricting access with - No Privileged VLAN
In the absence of a privileged VLAN, Balbix discovery would be limited to a segment. To gain granular visibility Balbix Network Discovery Module interface will need to obtain IP addresses from multiple segments (highlighted by dotted lines in the below mentioned diagram).
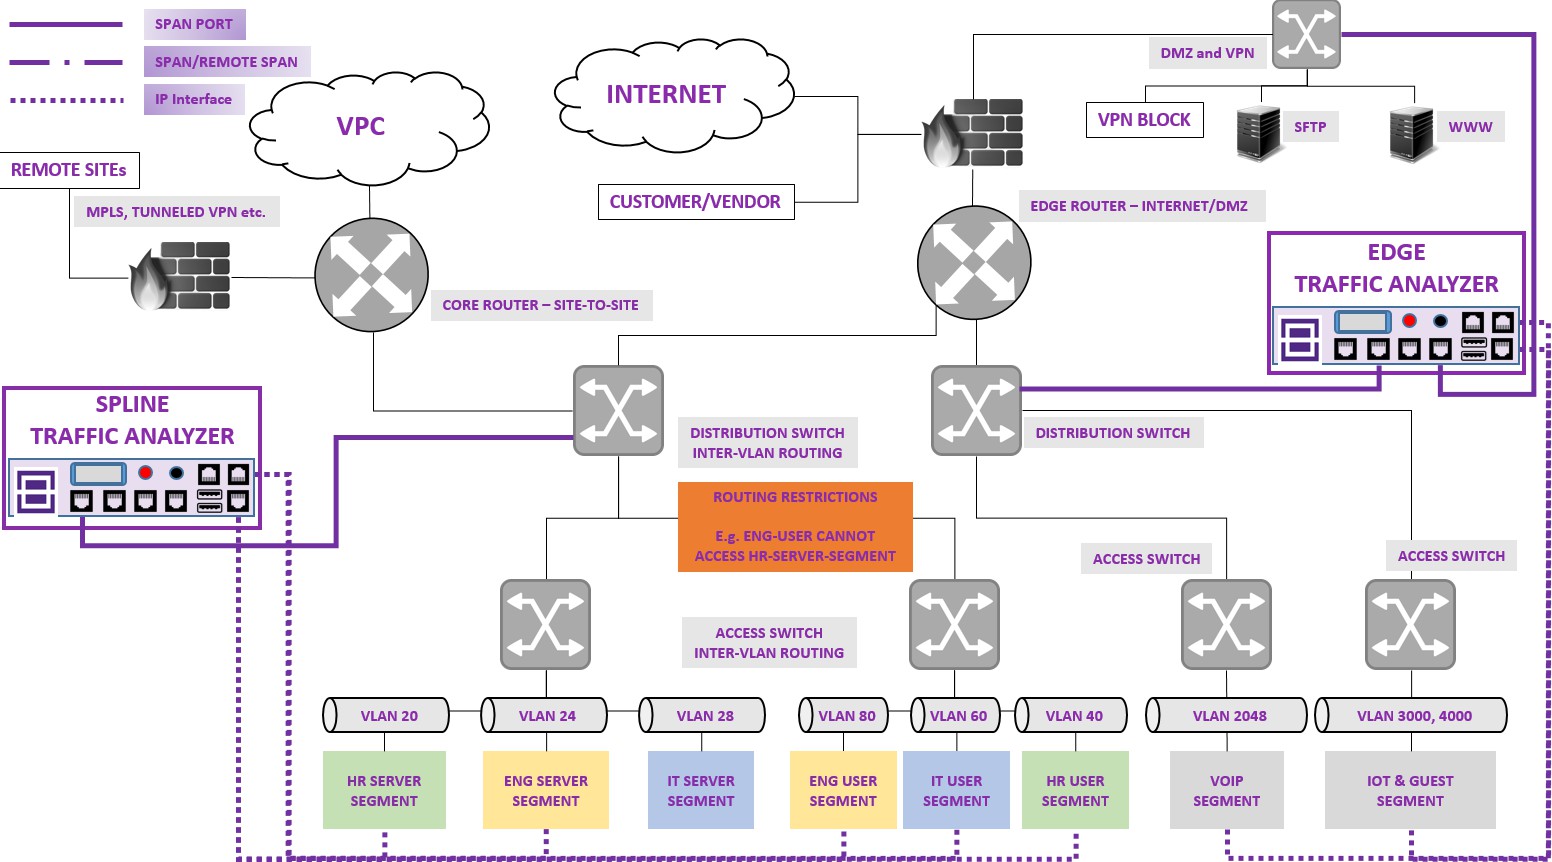
Note: For Traffic analysis span port from layer 2/3 switch needs to be connected to Balbix appliance data port interface 01 or 03 (As Data port 02 and 04 are mirror for 01 and 03 respectively).
Segmented network with SUBNETs defined by VLANs for restricting access where - restrictions are imposed by firewall rules between the segments
In this network model Balbix discovery would be limited. With firewall restrictions in place, to gain granular visibility following workarounds can be utilized.
Whitelisting of Balbix Network Discovery agent IP address to segments AND/OR
Balbix system can obtain IP addresses from multiple segments for discovery and analysis of the network in scope
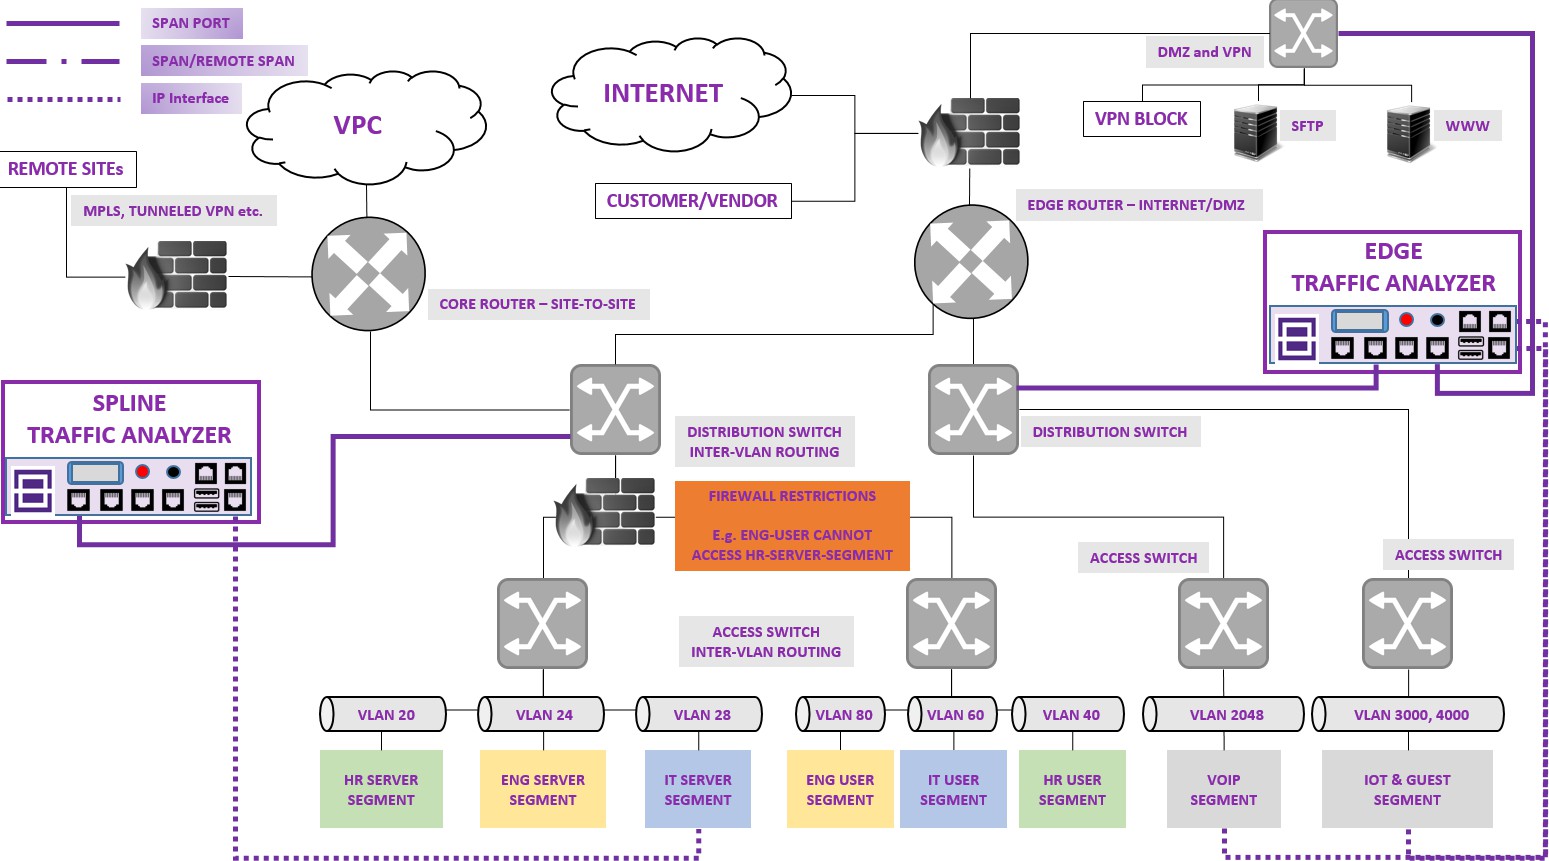
Note: For Traffic analysis span port from layer 2/3 switch needs to be connected to Balbix appliance data port interface 01 or 03 (As Data port 02 and 04 are mirror for 01 and 03 respectively).
Deployment Scenario in presence of a SPAN Aggregator
In the network where span aggregator is used and have available ports, Balbix appliance can be directly connected to span aggregator appliance for traffic visibility.
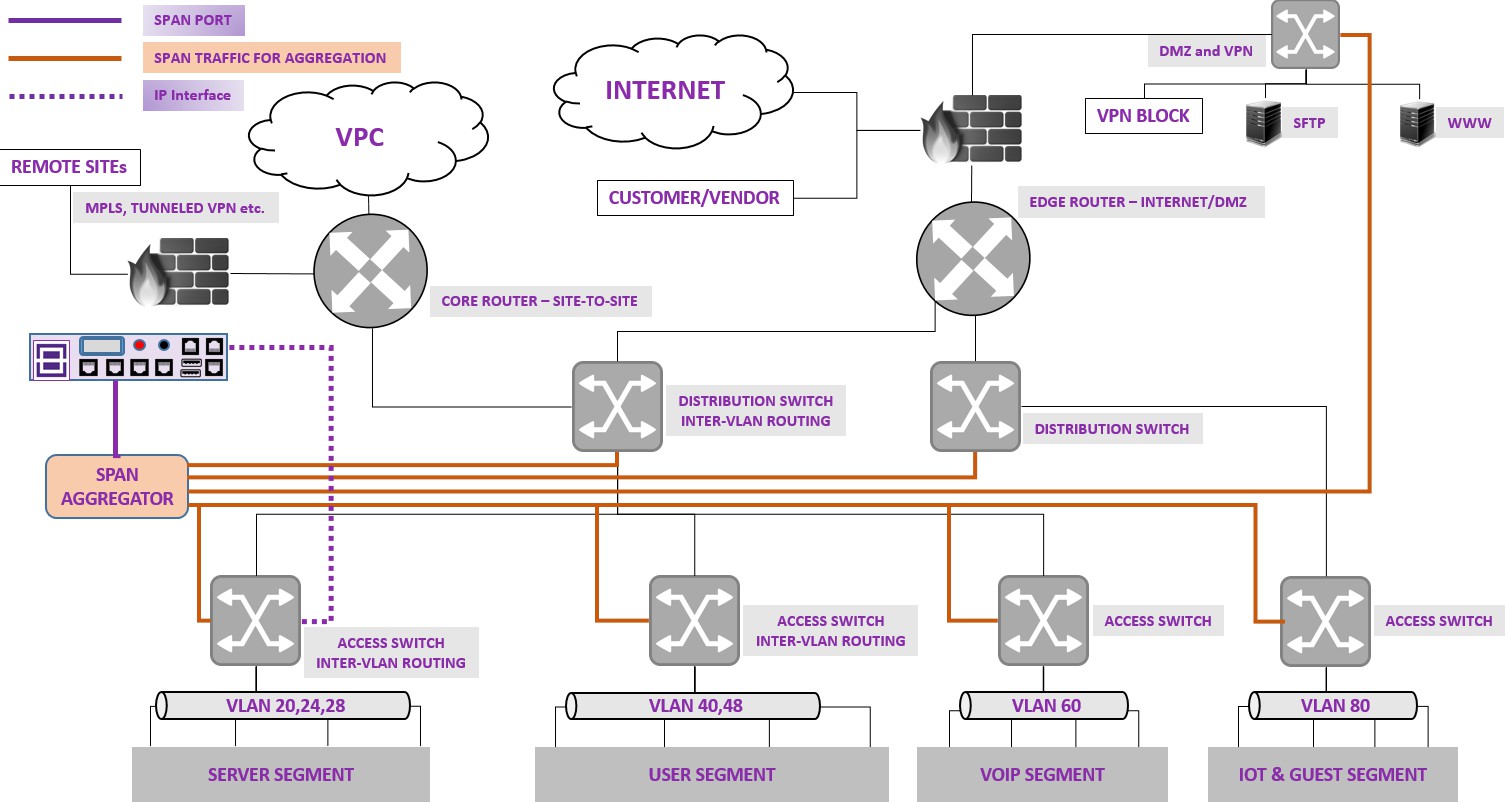
Note: For Traffic analysis span port from layer 2/3 switch needs to be connected to Balbix appliance data port interface 01 or 03 (As Data port 02 and 04 are mirror for 01 and 03 respectively).
Appliance Interface Connections
The Appliance is generally configured with two connections to the network switch.
Management Interface
Balbix appliance management interface acts dual purpose.
Used for network discovery and scanning (As mentioned in deployment scenarios)
Used for managing the appliance on local LAN
This interface allows you to manage Balbix Traffic Analyzer and perform queries and deep inspection of flowing traffic. The interface must be connected to a switch port that has access to all network endpoints.
Each Appliance requires a single management connection to the network. This connection requires an IP address on the local LAN. The management interface must have access to the following on your network:
PORT | SERVICE | TO OR FROM TA | FUNCTION |
22/TCP | SSH | Both | Allows access to the command line interface. |
Monitor Interface (For Data Traffic Observation)
This connection allows the Appliance to monitor and track network traffic. Traffic is mirrored to a port on the switch and monitored by the Appliance. Depending on the number of VLANs being mirrored, the traffic may or may not be 802.1Q VLAN tagged.
Single VLAN (untagged): When monitored, traffic is generated from a single VLAN, the mirrored traffic does not need to be VLAN tagged.
Multiple VLANs (tagged): When monitored, traffic is from more than one VLAN, the mirrored traffic must be 802.1Q VLAN tagged.
When two switches are connected as an Active-Active pair, the Appliance must monitor traffic from both the switches.
NOTE: No IP address is required on the monitor interface.
Set Up Your Switch
Switch Connection Option
The Appliance is designed to seamlessly integrate with a wide variety of network environments. To successfully integrate the Appliance into your network, verify that your switch is set up to monitor required traffic.
Standard Deployment - Passive Inline Tap (Separate Management and Monitoring Interfaces)
Instead of connecting to a switch monitoring port, the Appliance can use a passive inline tap. A passive tap requires one port to mirror both transmit and receive traffic, which will combine the two streams into a single port.
The recommended deployment uses two separate ports. These ports are described in Appliance Interface Connections.
Switch Setting Notes
VLAN (802.1Q) Tags
Monitoring a Single VLAN (untagged traffic): If the monitored traffic is from a single VLAN, traffic does not need 802.1Q tags.
Monitoring Multiple VLANs (tagged traffic): If the monitored traffic is from two or more VLANs, both the monitor and response interfaces must have 802.1Q tagging enabled. Monitoring multiple VLANs is the recommended option as it provides the best overall coverage while minimizing the number of mirroring ports.
If the switch cannot use an 802.1Q VLAN tag on the mirroring ports, do one of the following:
Mirror only a single VLAN
Mirror a single, untagged uplink port
Use the IP Layer response option
If the switch can only mirror one port, then mirror a single uplink port. This may be tagged. In general, if the switch strips 802.1Q VLAN tags, you will need to use the IP Layer response option.
Connect Network Cables and Power On
All Balbix appliances comes with 4 Data ports which can be programmatically configured.

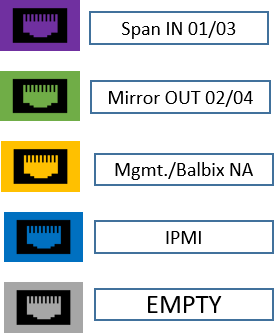
Default Config:
Purple Port 01 and 03 (from right to left) are Data IN ports which can be connected to span output of different network switches.
Green Port 02 and 04 (from right to left) are mirror of port 01 and 03 respectively.
Yellow Port 01 is the mgmt./NA (Network Analyzer port)
Blue Port is the IPMI port
Appliance Configuration
Prepare and save the following information from your appliance configurations view:
Appliance Host Name | |
Admin Password | Change default password and secure it in a Password Vault |
Management Interface IP | |
Network Mask | |
Default Gateway IP Address | |
DNS Domain Name | |
DNS Server |
Use the following commands to change the default password “admin” to a complex password:
Login | admin |
Password | admin (default password) or customer provided password |
Enable | Config term |
Enable | Password change (hit enter)
|
Remote Management
IPMI Setup
The IPMI is an integrated server system solution that gives you location-independent/OS-independent remote access over the LAN or Internet to Balbix Network Analyzer Appliances. Use the module to carry out KVM access, power on/off/reset and perform troubleshooting and maintenance tasks.
Perform the following to work with the IPMI module:
Enable and Configure the IPMI Module
To enable IPMI, log onto the sensor via SSH or console interface using the user “admin” and configured password. Then:
Enable | Config term
|
Verify the IPMI settings
To verify the settings for IPMI, please run the following command:
Enable | Show ipmi info |
Connect the Module to the Network
Login to IPMI
Navigate to https://<ip> on your browser.
Verify Connectivity
Balbix appliance provides console access through ssh or through plugging monitor and keyboard directly to the Serial and USB port on the appliance.
Use the following commands to check network connectivity and functionality of the appliance:
Login | admin |
Password | Customer provided password |
Enable | Show config (This command shows the current configuration of the sensor, which includes management interface configurations, default gateway, and DNS configurations. Please use this command to check if the configuration is setup correctly.) |
Enable | Show status (This command shows the upload status of the sensor.) |
Enable | ping balbix.com (This command allows you to ping any domain to verify both the DNS settings and the management interface configurations.) |