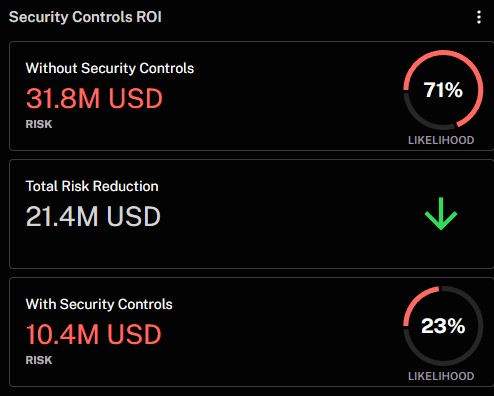
The Security Controls ROI widget quantifies the financial value of your current security controls by comparing risk with and without them. It shows how much risk your environment would face if no security controls were in place, and contrasts that with your actual risk after applying existing protections. The difference between these two values is presented as total risk reduction, giving you a clear, measurable view of the return on your cybersecurity investments.
Without Security Controls represents the level of financial risk your organization would face if no security measures were in place. It reflects the inherent risk—driven by existing vulnerabilities, threat landscape, and asset value—assuming attackers can operate without obstruction. This figure helps you understand your maximum unmitigated exposure.
With Security Controls shows your actual financial risk after applying the security controls currently deployed in your environment. This value reflects the risk that remains after your defensive posture has been accounted for.
Likelihood in both cases refers to the probability of a successful cyber incident, expressed as a percentage. A high likelihood without controls indicates that an attack is probable in an unprotected state. A lower likelihood with controls demonstrates how your mitigations reduce the chance of exploitation.
Total Risk Reduction is the difference in financial risk between the uncontrolled and controlled states. It quantifies the impact of your security investments in monetary terms, showing how much potential loss is being avoided due to your controls. This figure provides a business-aligned justification for the resources allocated to cybersecurity.
You can use this widget to evaluate whether your current controls are effectively reducing risk. A significant drop in both risk and likelihood indicates that your controls are successfully preventing or containing threats. For example, the reduction from a 71% to a 23% likelihood suggests that key mitigations are working as intended. This lets you identify which parts of your security program are delivering tangible value and where gaps might still exist.
This view is also helpful when communicating with leadership or justifying future investments. By expressing control effectiveness in financial terms, you can shift the conversation from technical details to business impact. If you're considering new tools or process improvements, the widget gives you a baseline for what your current setup is already achieving, helping to guide decisions on where to invest next for maximum additional risk reduction.
See Also: