You can find these options in the Remediations & Mitigations menu.
What You Can Do Here
Review open remediation tasks using the Tickets list in the Remediation & Mitigations view.
Investigate specific remediation efforts using the Ticket Details panel.
Analyze proposed resolutions through the Fixes section within each ticket.
Review exposures driving each ticket under the Exposures list.
Understand impacted infrastructure using the Entities linked to each ticket.
Organize grouped remediation efforts using the Projects section.
View summary-level information for a selected remediation effort in the Project Summary view.
Examine associated fixes and exposures in the Project Details tab.
Identify all entities involved in a project through the Entities view under Project Details.
You can also see the walkthrough in this link
Ticket Details
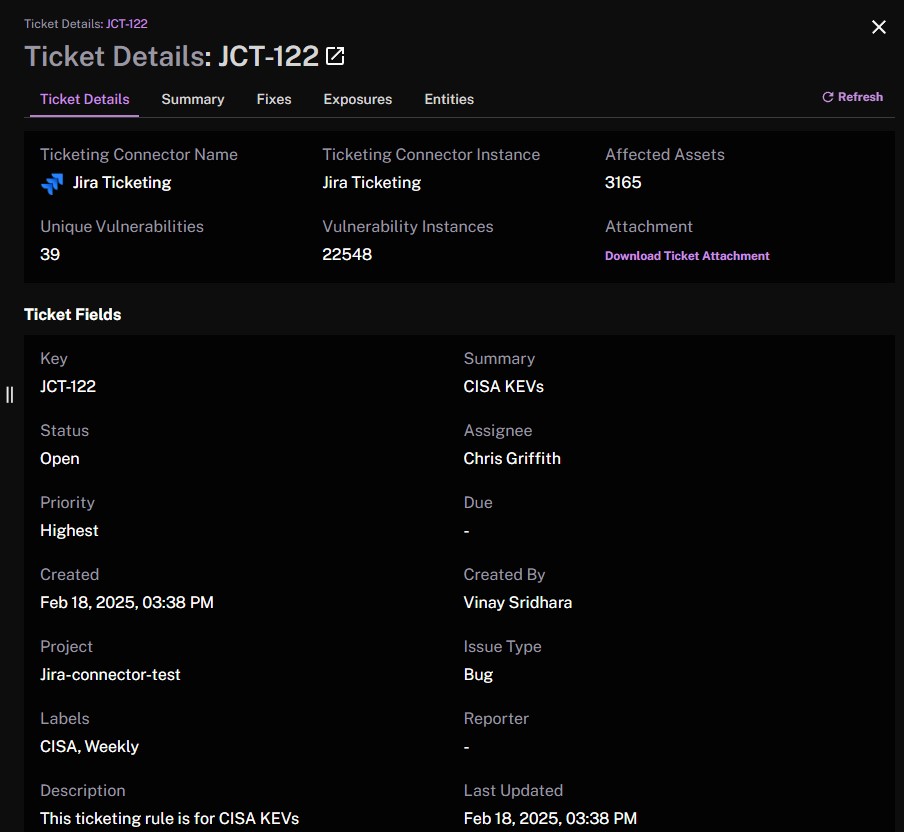
The Ticket Details tab provides a snapshot of the key details for a given ticket, including its status, priority, assignee, and summary. You’ll see the ticket key along with basic metadata such as who created it, when it was updated, and any labels or project information. The tab also shows how many assets and unique vulnerabilities are associated with the ticket, giving you a sense of its overall scope. If there’s an attachment available (such as a report or additional documentation), you can access it directly from this tab. This consolidated view helps you understand the context and urgency of the ticket at a glance.
Ticket Summary
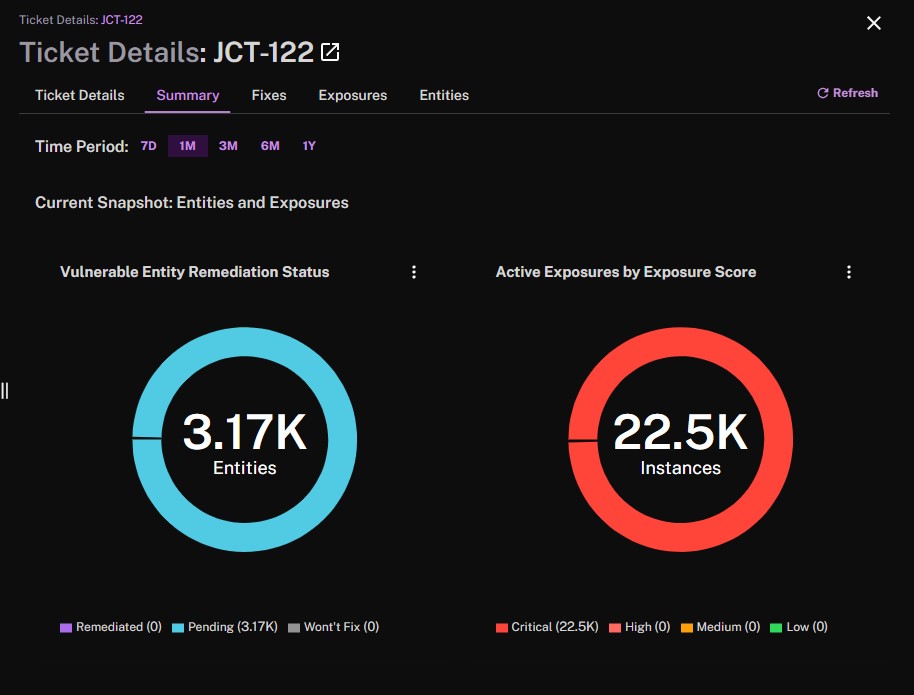
The Summary view in the Ticket Details interface offers a quick, at-a-glance perspective on how many entities and exposures are tied to the ticket, along with how remediation efforts are progressing. At the top, you can switch between different time frames—7 days, 1 month, 3 months, 6 months, or 1 year—to see how these metrics change over a chosen period.
Below that, you’ll see two donut charts. The one on the left shows the number of vulnerable entities, color-coded by remediation status (for example, Pending or Won’t Fix). On the right, there’s a chart that breaks down the total number of active exposures by their severity level (Critical, High, Medium, or Low). Together, these snapshots help you understand both the scope (in terms of entities affected) and the urgency (based on severity) of the vulnerabilities linked to the ticket.
Further down, a series of bar graphs track remediation progress over time. One graph shows how many vulnerable entities have been remediated versus those still pending. Another highlights how many exposures, broken out by severity, get remediated each day. You can also see similar charts organized by CVSS scores, giving you another angle on how critical these exposures are. These progress views let you quickly assess how remediation is moving forward and where additional effort may be needed.
Ticket Fixes
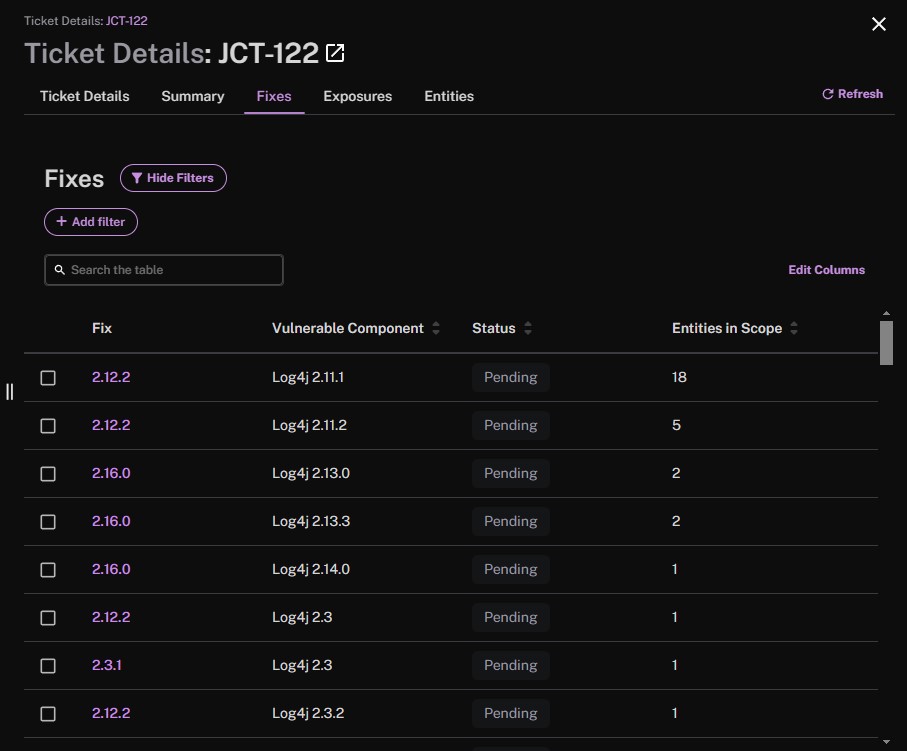
The Fixes tab shows you a table of recommended updates or solutions for the vulnerabilities associated with this ticket. Each row highlights a specific fix version (for example, 2.12.2 or 2.10.0) along with the corresponding vulnerable component (like Log4j 2.11.1) and its current remediation status. The “Entities in Scope” column tells you how many assets are impacted by that particular fix, giving you a sense of its priority. You can add filters to refine the list based on factors such as status or component, and you can also edit which columns appear in the table, allowing you to customize the view according to your needs.
Ticket Exposures
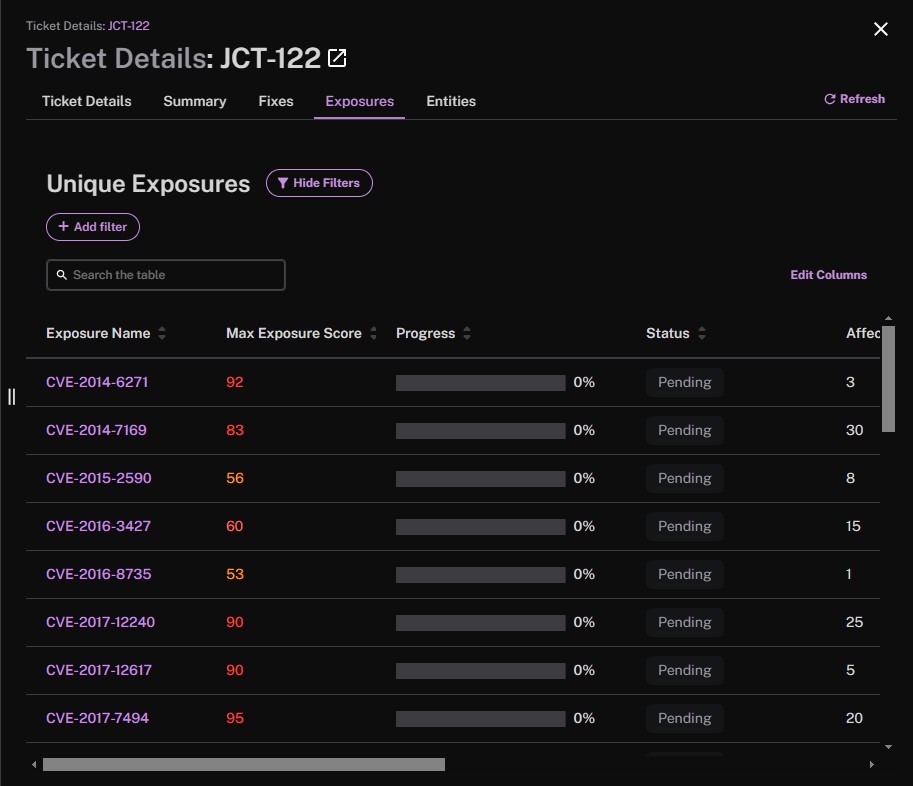
The Exposures tab lists all of the distinct vulnerabilities associated with the ticket, each shown alongside its maximum exposure score, remediation progress, current status, and the number of entities impacted. This view helps you quickly identify which vulnerabilities pose the greatest risk and how much work remains to address them. You can filter the table to focus on specific vulnerabilities, search by CVE name or other criteria, and even customize which columns are displayed to tailor the information to your needs.
Ticket Entities
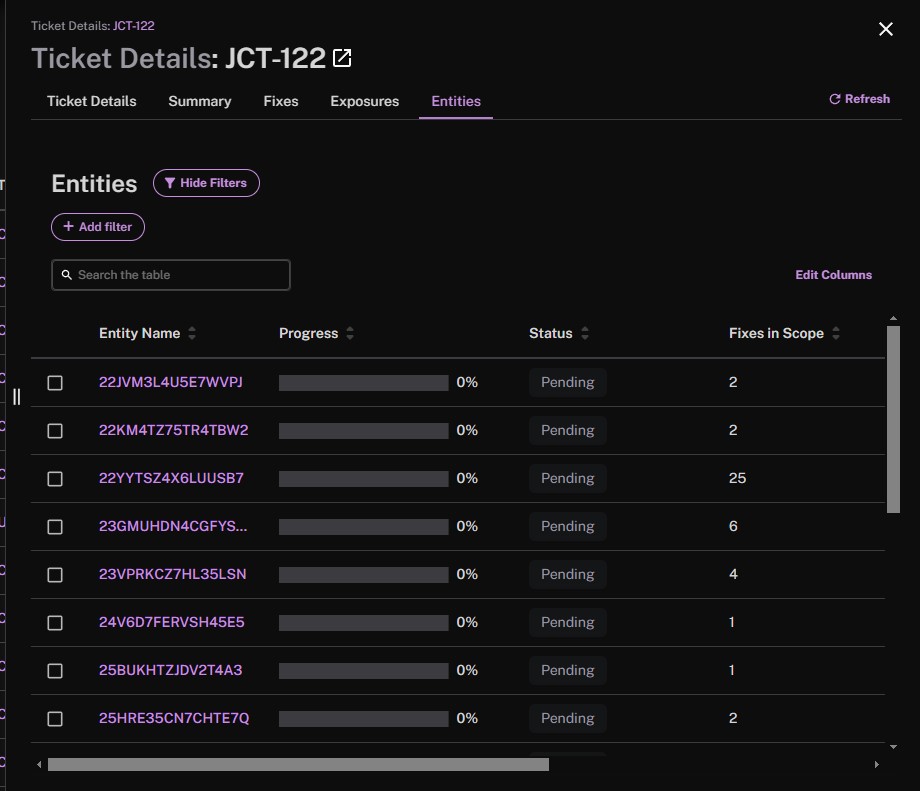
The Entities tab lists all the assets involved in the vulnerabilities tracked by this ticket. Each entity appears with a progress bar indicating how much of its remediation work is done, a status field (like “Pending”), and a count of the fixes in scope for that entity. You can search or filter the list to focus on specific assets, and you can customize the columns to see the details that matter most. This view makes it easy to track how each entity is progressing toward full remediation and to spot where additional action may be needed.
Project Summary
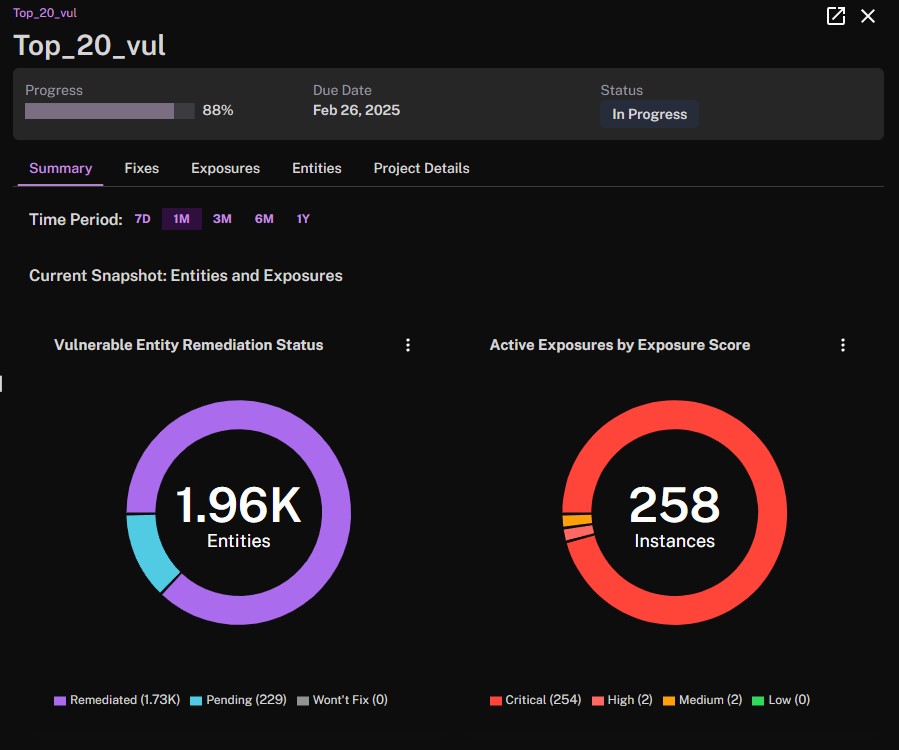
The Summary view for provides a high-level snapshot of its current status, due date, and overall progress for the remediation project. At the top, you can select a time range—7 days, 1 month, 3 months, 6 months, or 1 year—to see how metrics shift over different periods. Two donut charts display how many entities are vulnerable (color-coded by remediation status) and how many exposures are active (organized by severity level). Below, bar graphs track the daily progress of remediation. One set focuses on the number of entities remediated versus those still pending, while another shows exposures remediated over time, broken out by severity or CVSS score. These visualizations make it easy to see trends and gauge the effectiveness of your remediation efforts at a glance.
Project Fixes
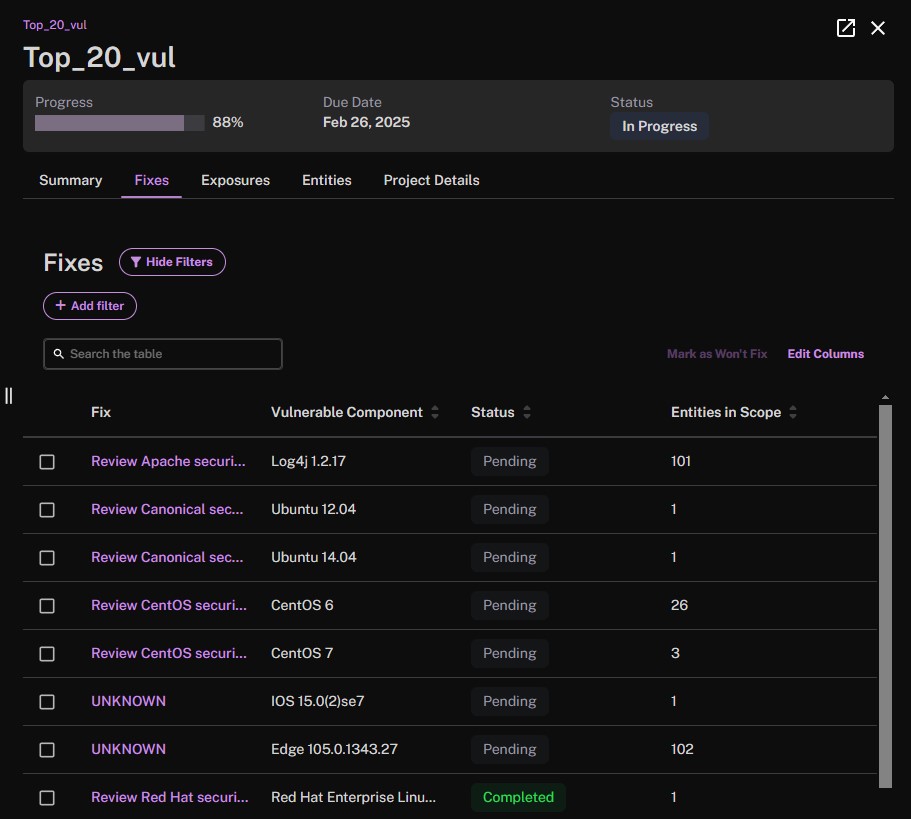
The Fixes tab lists the recommended actions or updates for the vulnerabilities included in this ticket. Each row displays a fix name (for example, “Review Apache security…”), the corresponding vulnerable component, its current status (such as Pending or Completed), and the number of entities that would be affected by that fix. You can use the filters at the top to narrow down the list by specific criteria, and there’s an option to mark certain items as “Won’t Fix” if they’re not going to be remediated. The “Edit Columns” feature lets you customize the table so you can focus on the details most relevant to your workflow.
Project Exposures
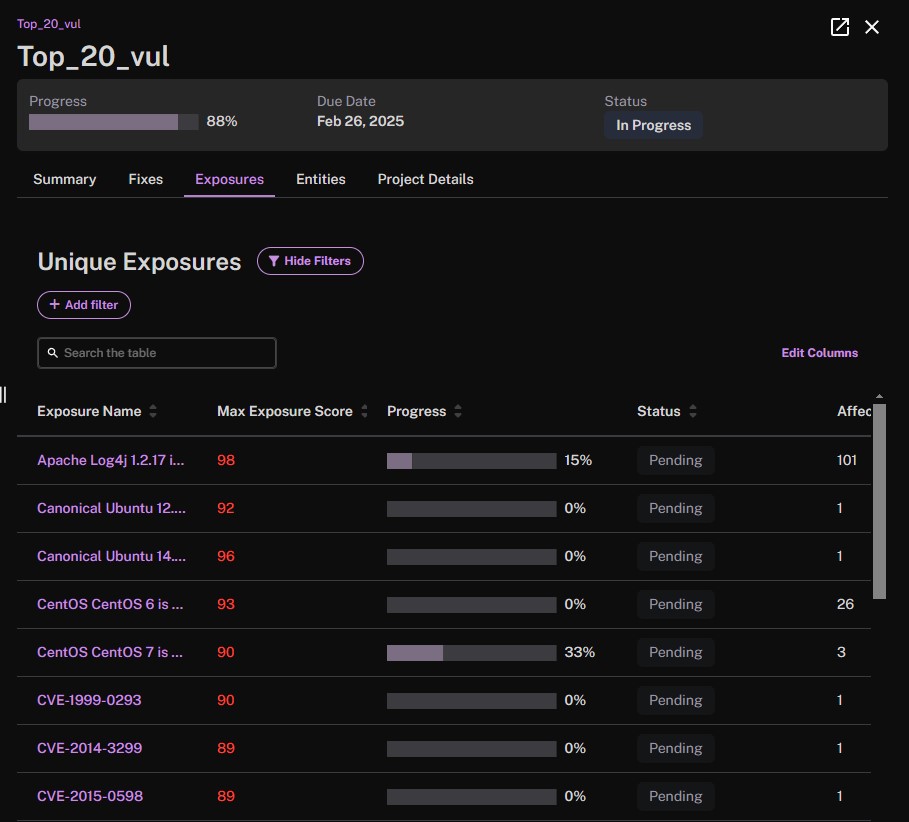
The Exposures tab lists each vulnerability under this ticket, showing its name, maximum exposure score, and the percentage of remediation completed. You can see its status, along with the number of entities impacted. A filter option at the top lets you narrow down which exposures you want to view, and you can customize the columns to focus on specific details. This helps you quickly identify the highest-risk vulnerabilities and track how much progress has been made in resolving them.
Project Entities
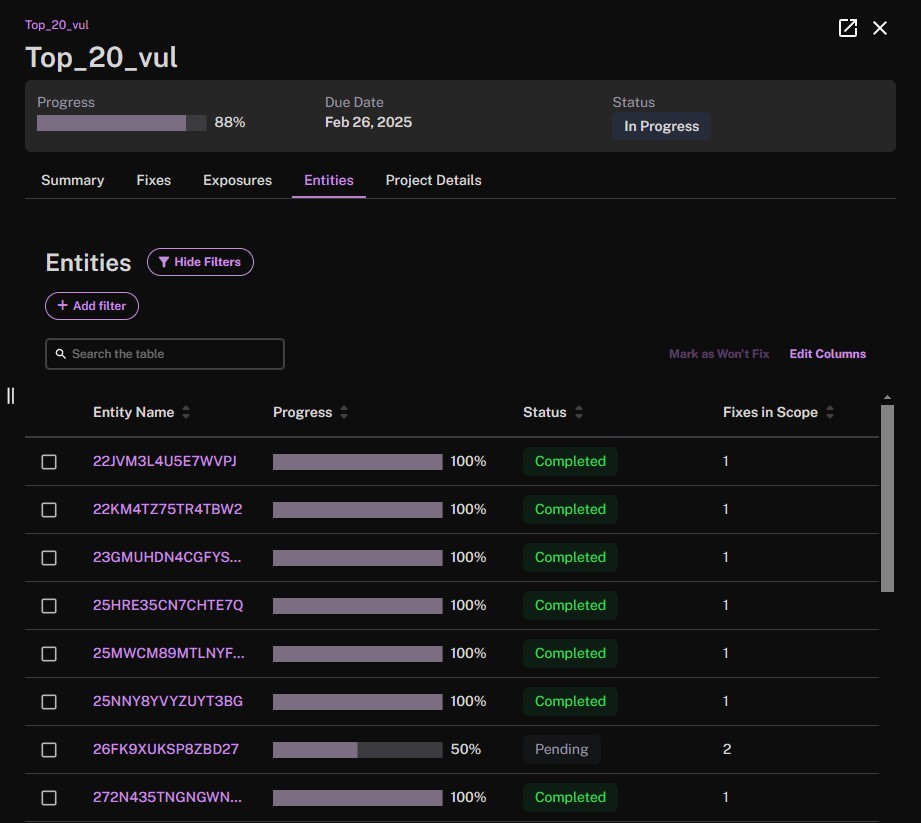
The Entities tab displays each asset affected by the vulnerabilities under this ticket, along with a progress bar indicating how close it is to full remediation. Next to each asset, you’ll see its current status (for example, Completed or Pending) and the number of fixes in scope. You can filter the list to find specific entities. You can also customize which columns are shown, giving you control over the level of detail you see for each entity.
Project Details
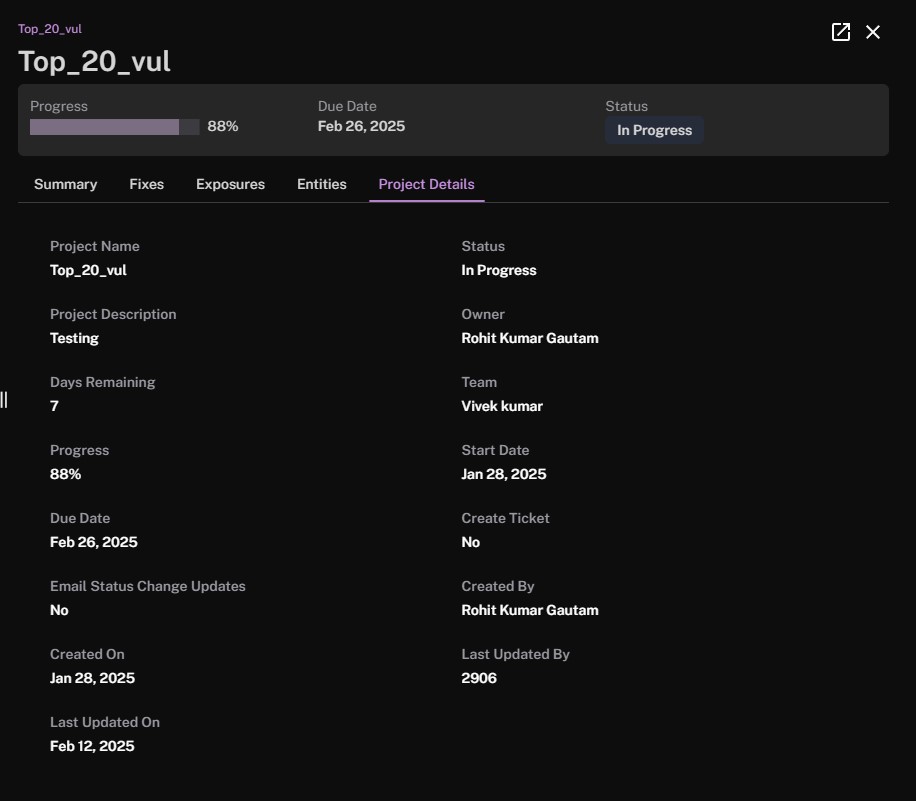
The Project Details tab offers a comprehensive overview of all the key information related to this project, including its name, description, due date, status, and current progress. It shows how many days remain before the deadline, whether email updates are enabled for status changes, and when the project was created or last updated. You’ll also see who owns the project, which team is assigned, and any relevant metadata (such as a ticket creation reference), making it easy to track who’s responsible and how close the project is to completion.
See also: