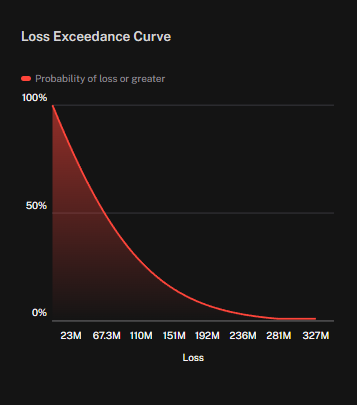
The Loss Exceedance Curve widget visualizes the probability of experiencing a financial loss at or above different thresholds. It provides a probabilistic view of potential cyber risk impact, allowing organizations to understand not just expected losses but also the likelihood of extreme outcomes.
Y-Axis (Probability of Loss or Greater) shows the probability, ranging from 100% (near-certain events) down to 0% (very unlikely events).
X-Axis (Loss) displays the magnitude of potential financial loss, expressed in millions.
Curve represents the probability distribution, sloping downward as loss amounts increase. For example, smaller losses (tens of millions) are more probable, while very large losses (hundreds of millions) occur with much lower probability.
This widget enables risk and security leaders to:
Quantify the likelihood of losses exceeding given financial thresholds.
Identify tail-risk scenarios that, while less probable, could have severe business impact.
Support decision-making around risk appetite, insurance, and prioritization of risk reduction investments.
See Also: