You can find these options in the Cyber Risk Summary menu.
What You Can Do Here
View enterprise-wide cyber risk metrics in the Cyber Risk Summary section.
Filter risk data by selecting different Asset Groups.
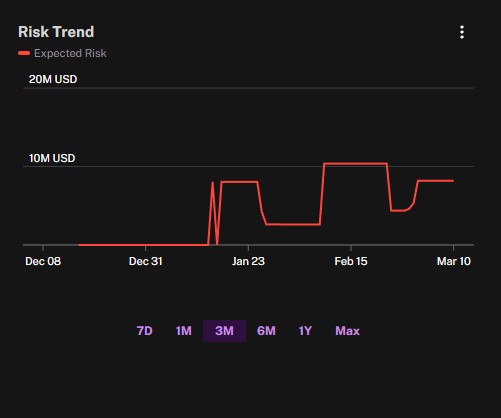
Analyze overall risk trajectory using the Risk Trend graph.
Interpret potential financial impact with the Loss Exceedance Curve.
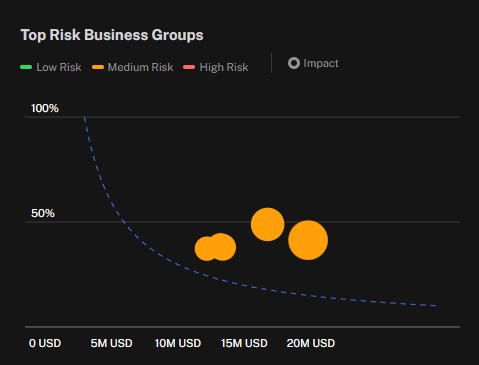
Identify high-risk business areas through the Top Risk Business Groups visualization.
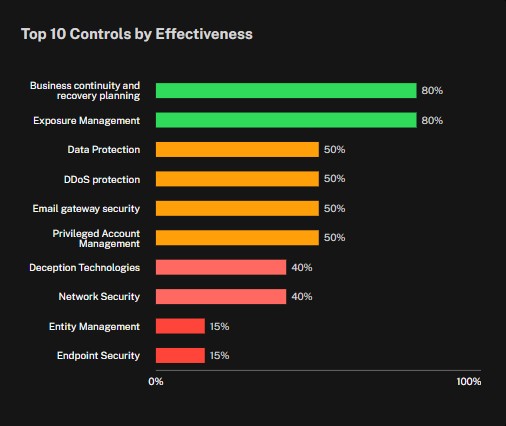
Examine control performance using the Top 10 Controls by Effectiveness chart.
Access prioritized mitigation data via the CTEM Bird’s Eye link.
You can also see the walkthrough in this link
Cyber Risk Summary
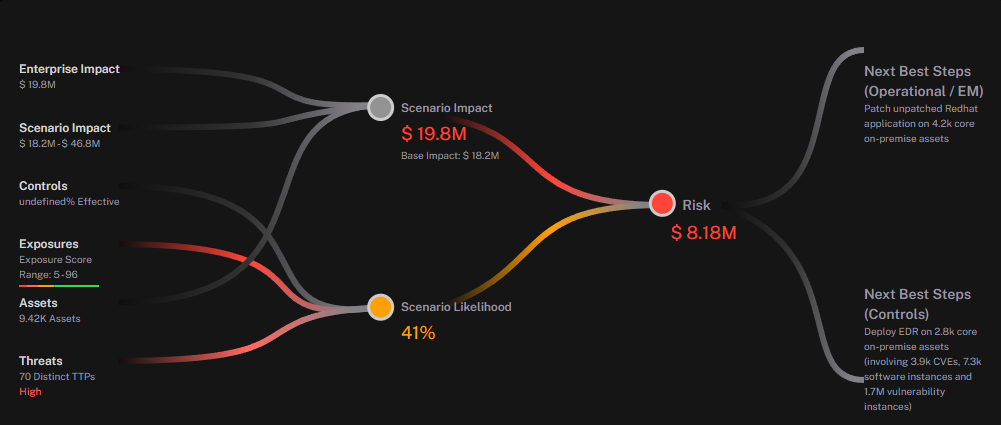
The Cyber Risk Summary – CTEM Birds Eye view presents a high-level snapshot of your organization’s overall cyber risk in monetary units, breaking it down by distinct categories to show where vulnerabilities might be most critical. Each category is represented as a branch from the central node, highlighting whether it’s currently being assessed and giving you an at-a-glance understanding of your security posture.
At the center, the risk is calculated based on two key factors: the scenario impact, which estimates the financial consequences of an incident, and the scenario likelihood, which reflects the probability of the event occurring.
On the left side, several contributing elements are detailed. Enterprise impact represents the overall potential financial damage. Scenario impact varies within a given range, depending on different conditions. If controls are implemented, they will lower the likelihood. Exposures show the level of risk present in the environment. Assets show the IT resources potentially affected. Additionally, threats show the level of risk and number or Mitre ATT&CK TTPs identified.
On the right side, recommended Next Best Steps mitigation actions are outlined to reduce the risk. These actions fall into two main categories:
Operational / Enterprise Management Actions: Addressing system vulnerabilities by applying necessary security patches to critical applications and infrastructure components.
Control-Based Actions: Enhancing security measures by deploying advanced threat detection and response tools to safeguard systems from known vulnerabilities, outdated software, and other exploitable weaknesses.
CTEM Bird’s Eye
.jpg)
The CTEM Birds Eye view provides a holistic snapshot of your organization’s security posture, integrating data from multiple sources and visualizing the relationships among assets, applications, and exposures, as well as the overall cyber risk.
Data Sources represent the various security and IT tools feeding information into the platform. These might include vulnerability scanners, endpoint protection systems, SIEMs, cloud infrastructure services, or any other source that can shed light on your assets and their exposures. Each data source contributes unique insights, which are then correlated and unified to provide a complete picture of your environment.
Assets are the individual entities being protected, such as servers, workstations, mobile devices, IoT devices, or virtual machines. The platform discovers and tracks these assets, collecting details like operating systems, installed software, and network configurations to assess their risk profile.
Apps refer to the applications identified within your environment. Tracking apps ensures you know what software is running where, and helps you address application-specific vulnerabilities or misconfigurations that could lead to breaches.
Exposures are the identified security gaps across your assets and applications. These might be vulnerabilities in software, missing patches, weak credentials, or misconfigurations in infrastructure. By collecting and prioritizing these exposures, the platform helps you focus on the most critical issues first.
Exposures Prioritized are those issues that the platform deems most urgent to address based on factors like severity, potential impact, and likelihood of exploitation. Prioritization ensures that remediation efforts target the highest-risk exposures first, optimizing both time and resources.
Cyber Risk represents the overall potential damage in financial terms your organization could face if the identified vulnerabilities were exploited. It factors in both the likelihood of a breach and the possible impact, offering a quantitative measure of your current security posture.
Dispatched for Automated Mitigation indicates exposures that the platform has routed to an automated process. This accelerates the remediation of routine or low-complexity tasks.
Dispatched for Manual Mitigation refers to exposures that require human review or intervention, often because they’re more complex or carry operational risks. Security teams may need to evaluate potential side effects of fixes or coordinate with other stakeholders before applying a patch or configuration change.
Exposures Deprioritized are issues that, after assessment, are deemed low-risk or otherwise acceptable to leave unaddressed for now. This category helps avoid clutter and ensures the security team remains focused on exposures that genuinely demand attention.
Raw Assets Analyzed shows the total number of newly discovered assets, reflecting how thoroughly the platform is scanning your environment. This metric is useful for understanding the scope of your asset inventory efforts.
Raw Exposures Analyzed represents the total number of exposures identified, giving insight into how many potential security gaps the platform is processing before they’re prioritized or remediated.
Work Avoided is the estimated reduction in manual labor thanks to automated processes, intelligent prioritization, and other efficiency gains. This figure highlights how the platform streamlines security operations, allowing teams to focus on critical tasks rather than routine, repetitive work.
Widgets
| The Risk Trend graph displays the expected financial risk due to cyber threats over a specified time period. The x-axis represents time, while the y-axis represents the expected financial impact in USD. The red line indicates the changes in expected risk over time. This graph provides visibility into how cyber risk exposure fluctuates, helping you monitor trends and assess the effectiveness of risk mitigation strategies. Spikes in the graph indicate periods where expected risk has increased, which may be due to newly identified vulnerabilities, threat activity, or changes in the organization’s digital footprint. A decreasing trend suggests that security measures are reducing risk exposure. Users can adjust the time range displayed using the available options (7D, 1M, 3M, 6M, 1Y, Max) to analyze short-term or long-term risk trends. This allows security teams to identify patterns, correlate risk fluctuations with specific events, and make informed decisions regarding cybersecurity investments and incident response. |
| The Loss Exceedance Curve (LEC) in the image represents the probability of experiencing a financial loss of at least a certain amount due to cyber risks. This type of curve is commonly used in risk management and insurance modeling to assess the likelihood of extreme financial losses. The x-axis represents different levels of financial loss, ranging from $1.13M to $46.8M. Each value along this axis signifies a possible loss amount due to cyber incidents such as data breaches, ransomware attacks, or system failures. The y-axis indicates the probability that the loss will meet or exceed a given dollar amount. It starts at 100% for very low loss amounts, meaning that any cyber incident will cause at least some financial damage. As the loss amount increases, the probability of reaching or exceeding that amount decreases, approaching 0% for extreme losses. The curve is steep at lower loss values, showing that smaller financial impacts are relatively common. It flattens as losses become larger, meaning that high-impact cyber incidents are rare but possible. The tail of the curve approaches zero, indicating that extremely large losses (e.g., above $40M) are very unlikely but not impossible. This graph is useful for cyber risk management in several ways. It helps organizations estimate their potential financial exposure to cyber risks. Insurers use LECs to price cyber insurance policies based on the likelihood of different loss scenarios. Companies can use this data to determine whether to invest in additional cybersecurity measures to reduce risk. Organizations in regulated industries may use LECs to demonstrate risk preparedness in compliance reporting. If an organization uses this curve to assess risk, it can answer questions like: What is the probability that we will lose at least $10M due to cyber incidents in a given year? The curve shows this probability at around 50%. What is the worst-case loss scenario we should prepare for? The curve suggests that a loss exceeding $40M is very unlikely but still possible. |
| The Top Risk Business Groups chart visualizes the cyber risk exposure of different business units based on their likelihood of experiencing a breach and the potential financial impact. Each circle represents a business group, with its position on the graph determined by its breach likelihood (y-axis) and expected financial impact in USD (x-axis). The size of the circle indicates the relative level of risk. The risk levels are color-coded: green for low risk, yellow for medium risk, and red for high risk. The dotted trend line provides a reference for expected risk distribution across business units. You can interact with the graph by clicking on a specific business unit's circle. This action reveals detailed risk metrics, including breach risk, breach likelihood, and breach impact for that particular unit. |
| The Top 10 Controls by Effectiveness chart ranks cybersecurity controls based on their effectiveness in mitigating risk. Each control is listed alongside a percentage value representing its assessed effectiveness. This visualization helps organizations identify which security controls are performing well and which may require improvement or additional investment. It supports decision-making for cybersecurity strategy by prioritizing controls that provide the greatest return on security investment. |
.jpg)