You can find these options in the Asset Vulnerabilities menu.
What you Can Do Here
Analyze vulnerabilities by exposure level in the Vulns by Exposure section.
Identify coverage sources using the Vulns by Data Source breakdown.
Assess severity distribution through the Vulns by Threat Level view.
Categorize vulnerability types using the Vulns by Type chart.
Review total unique vulnerabilities and affected assets in the Unique Vulnerabilities view.
Investigate specific impacted hosts using the Vulnerability Instances table.
Apply data filters using the Add Filter option.
Create complex filter logic using the Advanced Filters builder.
Reset applied filters using the Clear All function.
Trigger automation workflows, export data, and customize columns via the toolbar links.
Access full vulnerability context and metadata through the vulnerability detail view and its associated tabs.
You can also see the walkthrough in this link
Vulnerability Characteristics
Overview
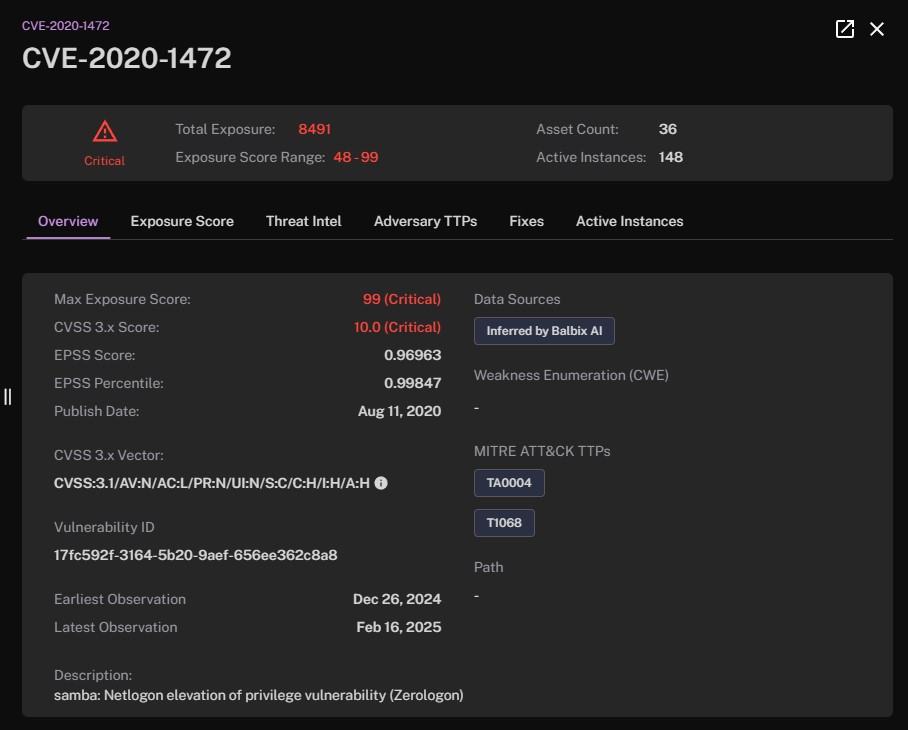
The Overview tab presents a high-level summary of the vulnerability you have selected, bringing together the most critical information in one place. It shows you the vulnerability name, its overall severity rating, and the maximum possible exposure score, so you can quickly gauge how serious the threat is. You will also see the exposure score range, which tells you the span of risk across all impacted assets. Balbix displays the CVSS 3.x score to give you an industry-standard benchmark of severity (on a 0–10 scale), along with the associated CVSS vector details that break down how the vulnerability behaves—things like required privileges, complexity, and potential impact.
You will notice additional fields that help quantify the likelihood and potential impact of an exploit, such as the EPSS (Exploit Prediction Scoring System) score, which estimates the probability that this particular vulnerability will be exploited. Balbix also shows the EPSS percentile, providing context by comparing that probability against other vulnerabilities. The tab highlights the total number of exposures in your environment and how many assets are affected, labeled as “asset count” and “active instances,” so you can understand the scope of the threat. In addition, you can find the publication date of the vulnerability, as well as the earliest time it appeared in your environment—helpful for assessing how long it may have been a risk. Finally, the Overview may include references and advisories that provide official guidance or background on the vulnerability, along with any relevant MITRE ATT&CK tactics or techniques.
Exposure Score
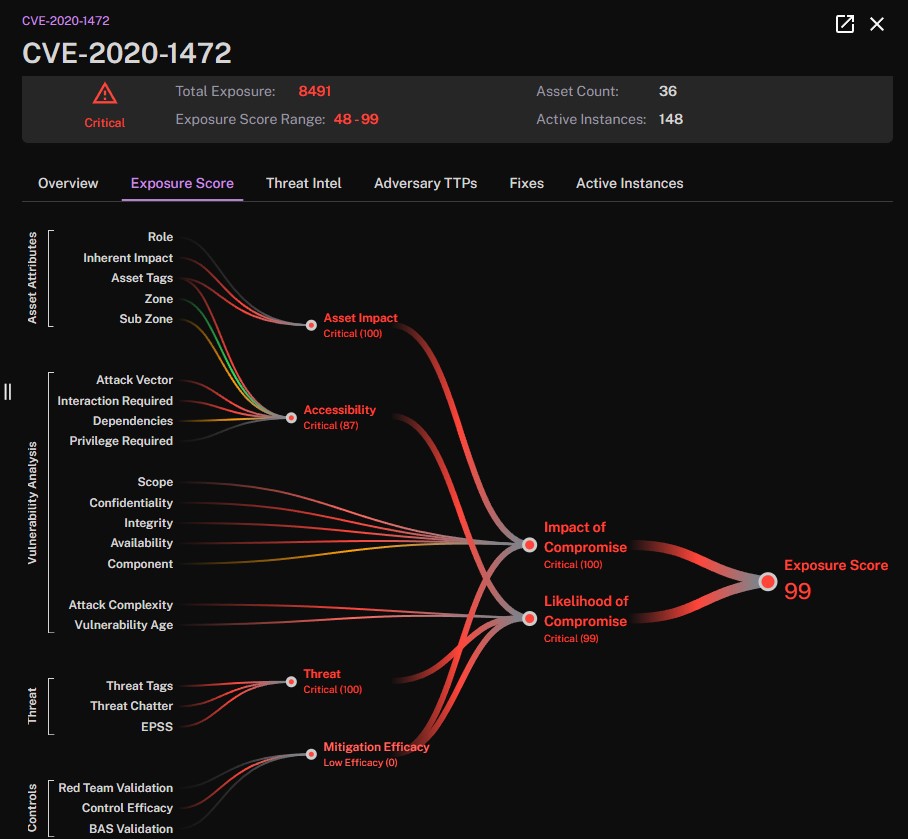
The Exposure Score tab provides a detailed look at how the overall risk score is calculated for a given vulnerability. At the top, you’ll see the aggregated exposure score, which encapsulates both the potential impact and the likelihood of a compromise. Below this, a visual breakdown divides the score into two main components: “Impact of Compromise” and “Likelihood of Compromise.” The “Impact of Compromise” section assesses the severity of potential damage to assets if the vulnerability is exploited, taking into account factors such as asset criticality and the extent of possible disruption. Meanwhile, the “Likelihood of Compromise” section evaluates the probability of the vulnerability being exploited, based on elements like ease of access, current threat activity, and mitigation measures in place. Each element within these categories is depicted as interconnected nodes, illustrating how they converge to form the final exposure score. This comprehensive view helps you understand not just what the score is, but why it is that value, enabling more informed risk management decisions.
Threat Intel
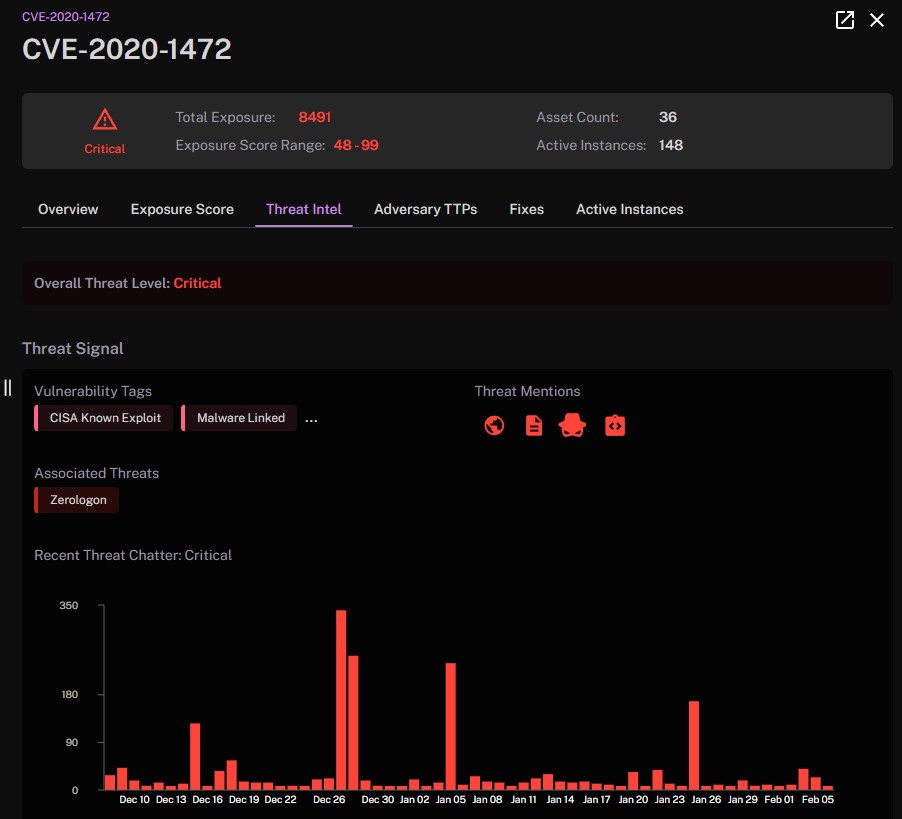
The Threat Intel tab aggregates external intelligence data to provide context about how the vulnerability is being discussed and exploited. You’ll see threat mentions from a variety of sources, each denoted by a distinct icon. The globe signifies social posts, indicating community chatter and real-time awareness, while the document icon represents in-depth infosec articles. The hat and glasses icon points to discussions on the dark web, hinting at covert chatter, and the clipboard stands for content from pastebin boards, offering another angle on public discourse. Additionally, you'll notice vulnerability tags that categorize the vulnerability according to industry-standard classifications or internal criteria. These tags help you quickly identify the type or nature of the vulnerability, such as whether it’s related to a specific software or part of a broader category like remote code execution or privilege escalation. The recent threat chatter graph displays the volume and trends of these discussions over time, providing insight into the evolving attention and potential risk associated with the vulnerability. Together, these elements enable you to assess both the current landscape of external intelligence and the relevance or urgency of addressing the vulnerability.
Adversary TTPs
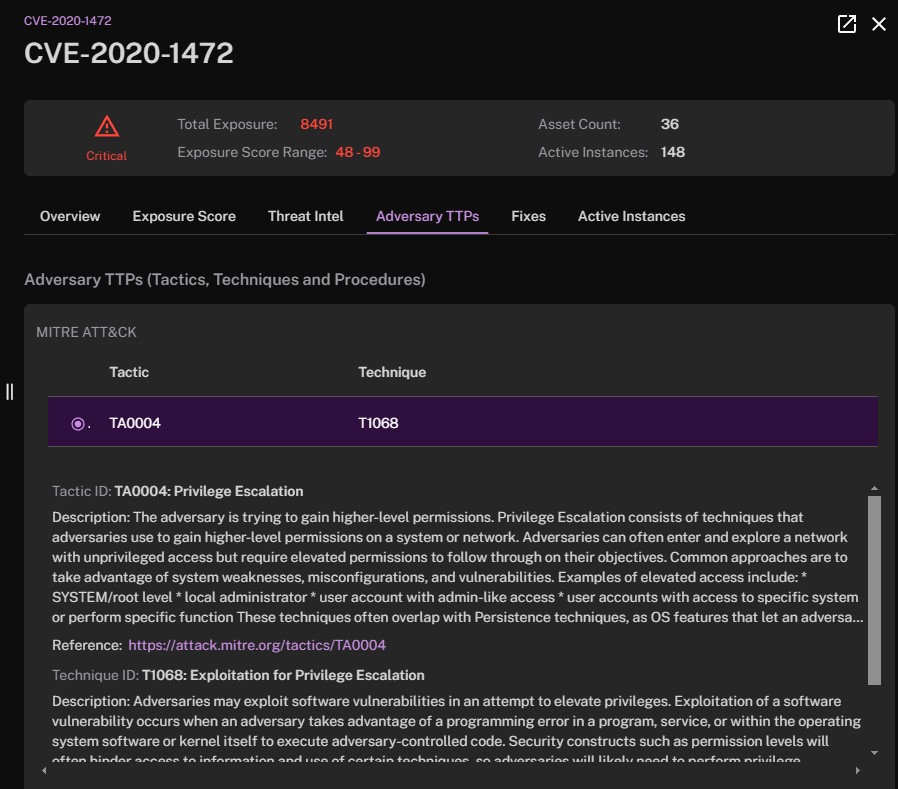
The Adversary TTPs tab provides insight into the tactics, techniques, and procedures that threat actors may use to exploit this vulnerability. It maps potential attack methods to MITRE ATT&CK, enabling you to understand how the vulnerability might be leveraged in an adversary's playbook. You’ll see details on specific tactics—whether it's initial access, lateral movement, or data exfiltration—along with corresponding techniques that give you a clearer picture of the attack chain. This contextual view not only helps in anticipating the adversary's moves but also informs your defense strategy by aligning remediation efforts with the most likely threat scenarios.
Fixes
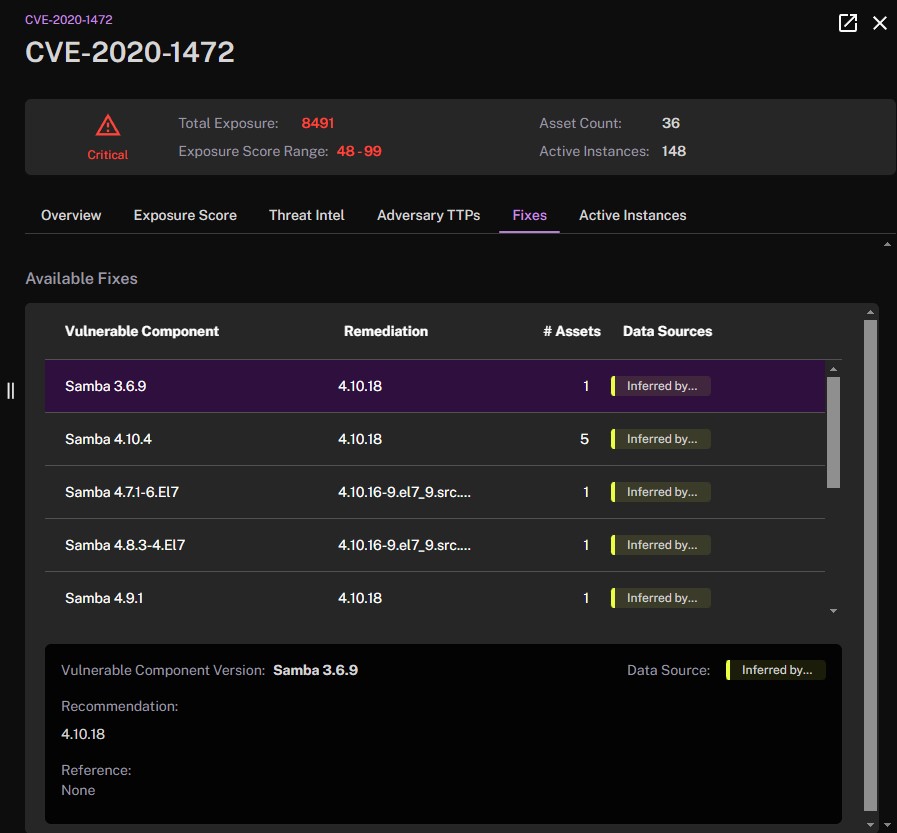
The Fixes tab outlines the recommended remediation strategies and mitigation measures to address the vulnerability. You'll find details on the remediation steps, including any dependencies or prerequisites that may be necessary for a successful fix.
Active Instances
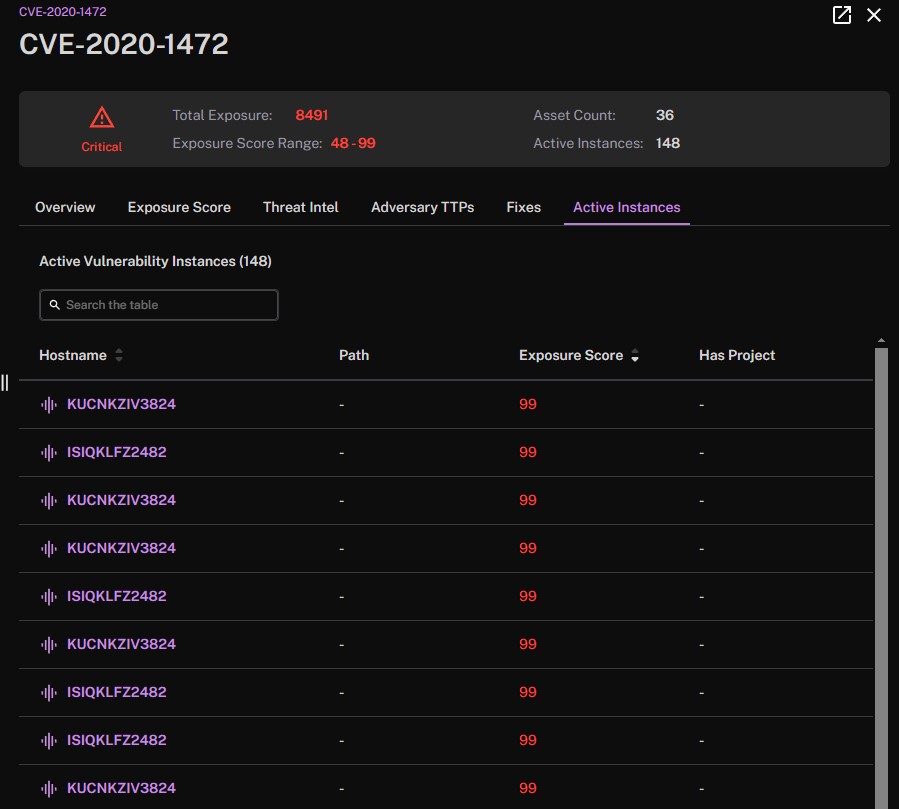
The Active Instances tab shows you a detailed list of assets in your environment that are currently affected by the vulnerability. For each instance, you'll see key information like the asset’s name, identification details, and a snapshot of its risk profile related to this vulnerability. This view is designed to give you a clear understanding of the scope of the threat, so you know exactly which assets require closer attention.
See Also: